
The practical answer
- Short answer
- A diligence team can rebuild your NRR in an afternoon. Here is the exact cohort formula, the 2025 Series B/C benchmarks, and why 120%+ earns a 63% valuation premium.
- Best fit
- Industry: B2B SaaS. Function: Finance & Strategy
- Operating path
- Revenue Architecture → Commercial Performance → Office of the CFO
- Key metric
- 2.5x Faster growth rate for high-NRR companies vs. low-NRR peers
A diligence analyst rebuilt my NRR in one afternoon — and it was eight points lower
Here is a scene that plays out in nearly every Series B and C raise. The founder presents a board deck with a clean 118% Net Revenue Retention number. The investor nods, then quietly hands the raw billing export to a 26-year-old analyst. By the end of the afternoon, that analyst has rebuilt NRR from invoices — cohort by cohort — and the number is 110%. Not because anyone lied. Because the founder's spreadsheet had quietly folded in three things it should never have touched.
The three usual culprits: new logos closed during the measurement window got mixed into the base. Mid-cycle downgrades were netted against upsells inside the same account so contraction never showed its face. And SMB, mid-market, and enterprise were averaged into one blended rate that hid an enterprise segment bleeding at 15%. Each of these inflates the headline. Together they manufacture a number that evaporates the moment someone touches the source data.
This matters more at your stage than at any other. Pre-Series A, growth rate is the story. By Series B and C, the story is efficient growth, and NRR is the cleanest proxy for it on the planet. It answers the single question that decides your multiple: if you stopped acquiring new customers tomorrow, would this business still grow on its own installed base? Software Equity Group's analysis of NRR and SaaS valuation is blunt about the gap it creates: companies above 120% NRR trade at roughly a 63% premium to the median. Below 100%, you are a shrinking asset, and the multiple reflects exactly that.
The trap most founder-CEOs fall into is the leaky bucket disguised as health. You report 100–105% retention, call it "fine," and burn cash maintaining a 20% growth rate by pouring sales and marketing into the top of the funnel to replace revenue draining out the bottom. The worst version masks the leak with aggressive upsells to a shrinking, increasingly unhappy base — which works right up until you run out of accounts to expand into.
In diligence, nobody trusts your NRR slide. They rebuild it from raw billing data. The only question that matters is whether your number survives the rebuild.
The formula that survives the rebuild — and the segment cut that breaks it open
Use the definition a diligence team will use, computed on a cohort basis. Take the set of customers active at the start of the period — say, every account that existed 12 months ago — and track only those accounts:
NRR = (Starting ARR + Expansion ARR − Contraction ARR − Churned ARR) ÷ Starting ARR
The discipline that makes it honest: no new logos from the current period, and contraction is never netted away inside an account. If a customer adds $40K of seats and loses $30K elsewhere, that is $40K expansion and $30K contraction — not $10K of "net upsell." Diligence tracks both gross flows because they tell different stories.
Why your blended NRR is lying to you
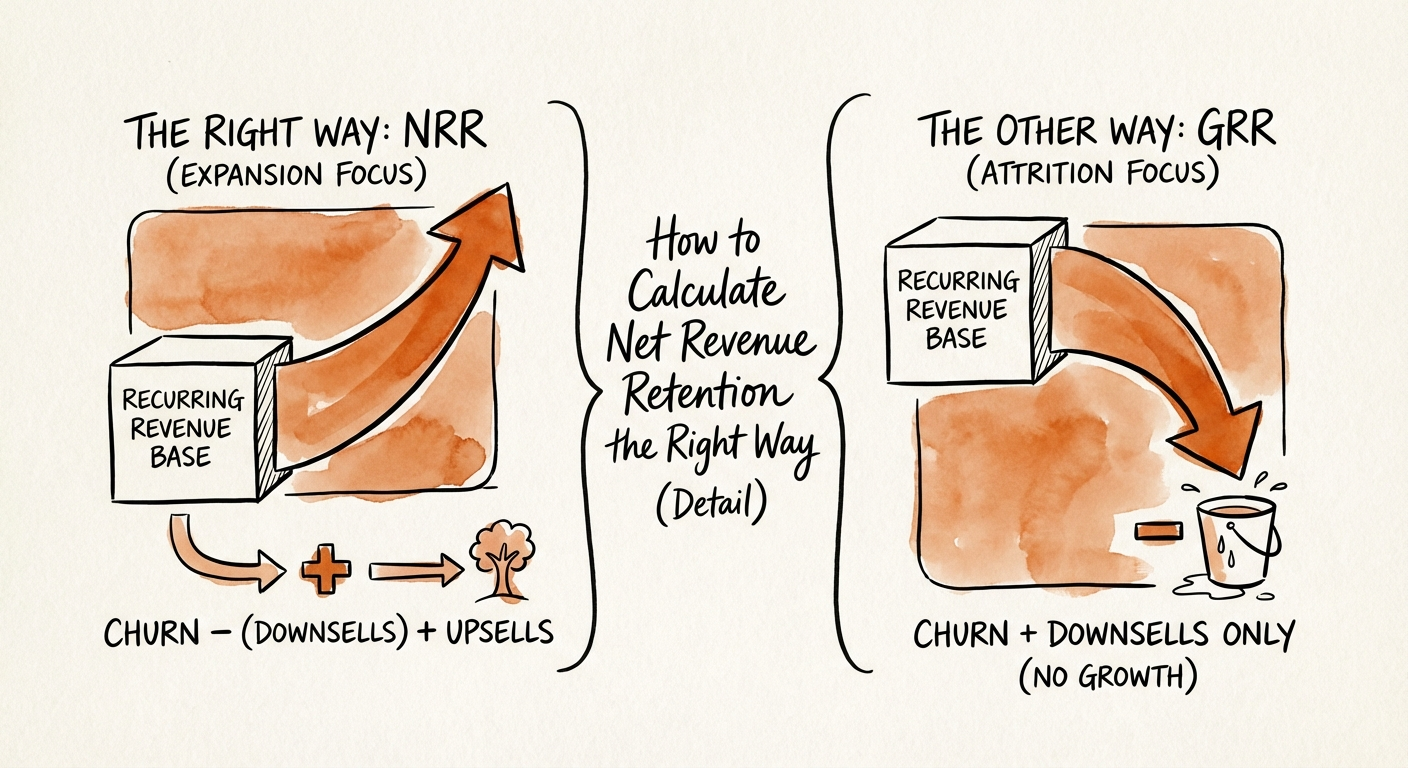
Say you start with 10 customers paying $100K each — $1M ARR. Two churn entirely (−$200K). The surviving eight expand by $300K total. Ending ARR is $1.1M, so NRR reads 110%. Looks investable. But Gross Revenue Retention — which strips out expansion — is only 80%. You lost a fifth of your base in a single period and papered over it with upsell. Gross Revenue Retention reveals true product-market fit; NRR only measures how well you monetize the customers who stay. A sophisticated buyer looks at both and walks toward whichever is worse.
Where Series B/C SaaS actually lands in 2025
Calibrated against the public-facing benchmark sets — Bessemer's Cloud 100 Benchmarks and SaaS Capital's 2025 retention benchmarks for private B2B companies — here is the map for your stage:
- 120%+ — the multiple-movers. These companies grow roughly 2.5x faster than low-NRR peers and command the premium multiple. The base alone funds material growth.
- 105–115% — investable, with homework. Stable foundation, but your expansion engine (pricing power, cross-sell, seat growth) is underbuilt. You're leaving the premium on the table.
- Below 100% — contracting asset. This is not a sales problem you can hire your way out of. If you're here, look at what's actually broken in Customer Success before adding a single rep.
Run one cut before your next board meeting: NRR by segment, separately for SMB, mid-market, and enterprise. The blended number is almost always hiding a wide spread, and the spread is the actual finding.
Three moves that change the number before your next raise
If NRR is lagging, effort won't close the gap — structure will. These are the levers I reach for first, in order of speed-to-impact.
1. Read contraction as the early warning it is
Most founders watch churn (customers leaving) and ignore contraction (customers spending less). In seat- or usage-based models, contraction is the first tremor before churn — a customer trimming seats this quarter is often the same customer that doesn't renew next year. Segment your NRR by account size and act on the spread. If SMB NRR is 90% and enterprise is 125%, the answer isn't subtle: stop pouring acquisition spend into the segment that doesn't retain, and reallocate to the one with proven unit economics.
2. Pay Customer Success on the number you actually want
If your CS team is compensated on "happiness" or health scores, you'll get happy customers who don't expand. Tie the comp to the outcome. A workable Series B/C structure: 70% base, 30% variable, with the variable split evenly between renewal/GRR (defend the base) and expansion/NRR (grow it). That split forces a team to do both jobs instead of optimizing for whichever is easier to report.
3. Take the price increase you keep postponing
A 5–7% annual uplift is unremarkable in B2B SaaS, and it is the fastest NRR lever you have — it adds no headcount and lands across the entire base at once. The fear is that it spikes churn. In practice, customers who are genuinely embedded absorb a single-digit increase without blinking; the ones who walk over 5% were already shopping. If a routine uplift triggers a churn wave, you've found a product-stickiness problem, not a pricing mistake — and you'd rather find it now than in the data room.
What to do Monday
Pull your raw billing export, rebuild last year's NRR on a strict cohort basis, then break it out by segment. The gap between that number and your board slide is your real diligence risk — and it's far cheaper to close before an investor's analyst finds it for you. Treat retention as a CEO problem, not a Customer Success line item. At your stage, the multiple is built on this one number.