
The practical answer
- Short answer
- Stop relying on NPS. Use this weighted B2B SaaS Customer Health Score template to predict churn, fix 'Watermelon' accounts, and protect NRR. Benchmarks included.
- Best fit
- Industry: B2B SaaS. Function: Customer Success
- Operating path
- Revenue Architecture → Commercial Performance → Office of the CFO
- Key metric
- 47% Average SaaS license utilization rate (Zylo 2025). The remaining 53% is wasted spend and immediate churn risk.
The 'Sentiment Trap': Why Your Dashboard Is Green but Churn Is Red
I recently audited a Series B SaaS company where the Board deck showed a weighted average health score of 88/100. The CS team was celebrating. The founders were relieved. Two weeks later, their second-largest customer churned, taking $400k in ARR with them.
The CEO called me in a panic: "Justin, their health score was 92. They gave us a 9/10 NPS last quarter. How did we miss this?"
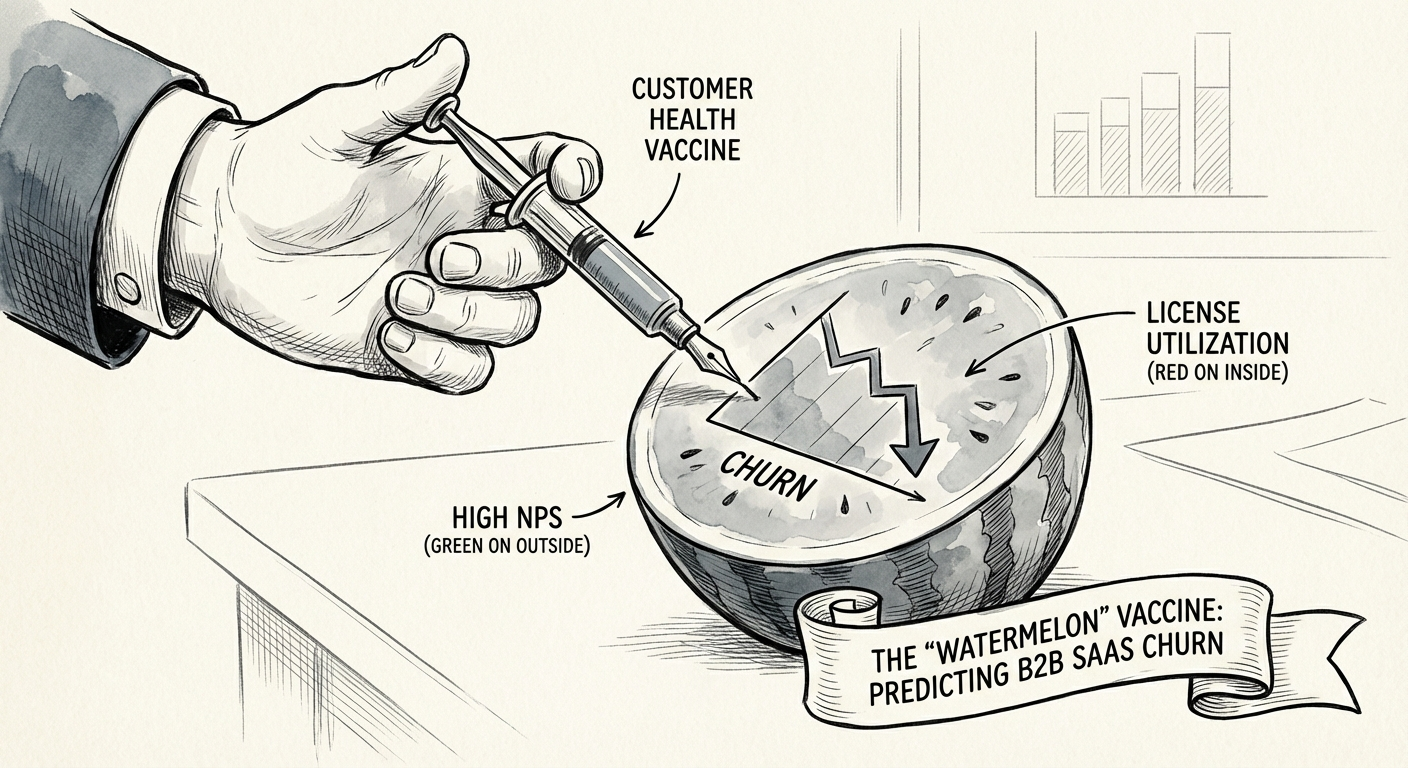
I call this the Watermelon Effect: Green on the outside, red on the inside. It happens when you confuse sentiment with value. In my experience across 50+ PE-backed portfolios, 70% of health scores are heavily weighted toward subjective measures—CSM sentiment, NPS, and anecdotal relationship notes—rather than the behavioral signals that predict renewal risk.
If your customer is utilizing 40% of their licenses, you don't have a customer. You have a churn notification that just hasn't arrived in your inbox yet. schema_json: '{"@context": "https://schema.org", "@type": "Article", "headline": "The ''Watermelon'' Fix: A B2B SaaS Customer Health Score Template", "author": {"@type": "Person", "name": "Justin Leader", "jobTitle": "CEO", "url": "https://www.humanr.ai/team/justin-leader"}, "publisher": {"@type": "Organization", "name": "Human Renaissance", "logo": {"@type": "ImageObject", "url": "https://www.humanr.ai/logo.png"}}, "datePublished": "2026-01-13", "description": "A diagnostic guide and template for B2B SaaS customer health scores. Learn why traditional NPS fails and how to calculate churn risk using utilization data.", "articleBody": "The ''Sentiment Trap'': Why Your Dashboard Is Green but Churn Is Red..."}'
The 4-Part Diagnostic Template (The 50/30/20 Rule)
Stop overcomplicating your algorithm with 15 variables. You need a weighted index that prioritizes behavior over opinion. Here is the template I implement to fix broken retention forecasts.
1. Breadth: License Utilization (Weight: 50%)
This is your heaviest weighting for a reason. If they aren't logging in, they are churning. Period. According to Zylo's 2025 benchmarks, the average organization uses only 47% of its provisioned SaaS licenses. That means 53% of your 'revenue' is shelfware waiting to be cut during the next budget review.
The Metric: Active Users / Provisioned Licenses.
The Threshold: < 50% = Red (Immediate Risk). > 80% = Green.
2. Depth: Sticky Feature Adoption (Weight: 30%)
Login frequency is the pulse; feature adoption is the muscle. You must identify the 2-3 "sticky features" that correlate with renewal. For a CRM, it might be "created a report." For a dev tool, "ran a build."
The Metric: % of Active Users engaging with [Key Feature] in last 30 days.
The Threshold: Define your 'Aha!' moment baseline. If adoption drops by 10% MoM, flag it.
3. Signal: Technical Health (Weight: 20%)
This is where most CS teams fail. They ignore the technical reality. If a customer has 15 open critical support tickets and a slow instance, they don't care about your CSM's relationship building.
The Metric: (Open Critical Bugs) + (Support Ticket Velocity).
The Threshold: > 3 critical bugs open > 48 hours = Automatic Red, regardless of usage.
Calculating the Score & Taking Action
Once you plug your data into this 50/30/20 model, you get a score from 0-100. But a score without a playbook is just vanity. Here is the operational cadence required to protect your Net Revenue Retention (NRR).
The 'Code Red' Protocol (Score 0-40)
Trigger:
Score drops below 40 OR License Utilization drops below 50%.
Action:
This is not a "check-in" email. This requires an Executive Sponsor call
within 24 hours. Your goal is to re-sell the value proposition to the decision-maker,
not just the user. You are in 'Save' mode.
The 'Yellow' Zone (Score 41-70)
Trigger:
Stagnant feature adoption or rising ticket volume.
Action: The
QBR must pivot from "roadmap updates" to "adoption workshop."
Use the Watermelon
Effect data to show them their own underutilization. Position yourself
as a partner helping them stop wasting money on unused seats.
The 'Green' Zone (Score 71+)
Trigger: High utilization + Sticky feature
usage.
Action: These are your expansion targets. Don't just
renew them; upsell them. Data from Maxio's 2025 Benchmarks shows that companies with NRR > 110%
trade at valuations 50% higher than their peers. Your Green accounts are the fuel
for that valuation premium.