The practical answer
- Short answer
- Why PE buyers discount multi-product companies by 20% and how to flip the narrative. Benchmarks for attach rates, cross-sell CAC, and platform premiums.
- Best fit
- Industry: B2B SaaS. Function: Corporate Development
- Operating path
- Exit Readiness → Operational Excellence → Transaction Advisory Services
- Key metric
- 50% Target reduction in CAC for cross-sell vs. new logo to justify platform valuation.
The 'Conglomerate Discount' in SaaS Exits
In the private equity playbook, a single-product SaaS company growing at 40% is a pristine asset. It has one metric to track, one customer profile to serve, and one codebase to maintain. A multi-product company with the same aggregate revenue often triggers a different reaction: skepticism.
We call this the Multi-Product Paradox. Founders assume that launching a second product diversifies revenue and increases Total Addressable Market (TAM), inherently raising enterprise value. However, sophisticated buyers in 2026 often apply a "Conglomerate Discount"—shaving 15-20% off the EBITDA multiple—unless specific efficiency criteria are met.
Why Buyers Discount Your Second Product
The discount stems from the "Hidden Drag" that secondary products place on the organization. When we audit multi-product portfolios during due diligence, we frequently find:
- Diluted GTM Focus: Sales reps default to selling the "easier" legacy product, leaving the new product with high CAC and low velocity.
- OpEx Bloat: R&D costs double while revenue only grows by 20%, depressing the Rule of 40 score.
- Support Complexity: Customer success teams struggle to support disjointed workflows, leading to a spike in "confusion churn."
If your second product has an attach rate below 15% and a CAC comparable to your core product, buyers won't value it as a growth lever. They will value it as a distraction, often assigning it a lower multiple (e.g., 2x Revenue) than your core business (e.g., 6x Revenue), dragging down your blended valuation.
If your Cross-Sell CAC is equal to your New Logo CAC, you don't have a platform; you have two startups sharing an office.
The Diagnostic: Earning the 'Platform Premium'
To flip the script from a discount to a "Platform Premium" (where the whole is worth more than the sum of its parts), you must prove that your multi-product architecture drives compounding efficiency. This isn't about narrative; it's about physics.
1. The Cross-Sell CAC Delta
The primary financial justification for a platform is that selling Product B to an existing customer should be significantly cheaper than acquiring a new logo. In 2026, top-tier platforms demonstrate a Cross-Sell CAC that is 50-70% lower than New Logo CAC.
If your Cross-Sell CAC is equal to your New Logo CAC, you don't have a platform; you have two startups sharing an office. Buyers will value them separately, often disregarding the "synergy" you claim exists.
2. The 'Attach Rate' Threshold
Attach rate—the percentage of core customers who purchase the secondary product—is the ultimate litmus test for product-market fit within your installed base. Horizontal vs. Vertical expansion strategies yield different benchmarks, but the valuation inflection points are consistent:
- <15% Attach Rate: The product is considered "experimental." PE buyers may treat its revenue as non-recurring or low-quality in the Quality of Earnings (QofE) report.
- 15-30% Attach Rate: The product is "validated." It contributes to retention but doesn't yet drive premium multiples.
- >30% Attach Rate: The "Platform Zone." At this level, the second product demonstrably increases Net Revenue Retention (NRR) and lifetime value (LTV). This is where you unlock 10x+ multiples.
3. The R&D Leverage Ratio
Can you ship features for Product B using the infrastructure of Product A? If every new product requires a linear increase in engineering headcount, your margins will never scale. Buyers look for Shared Services Leverage—common identity management, billing, and UI components. If your "platform" is actually three acquisitions duct-taped together with single-sign-on (SSO), expect a Technical Debt Haircut of 10-15%.
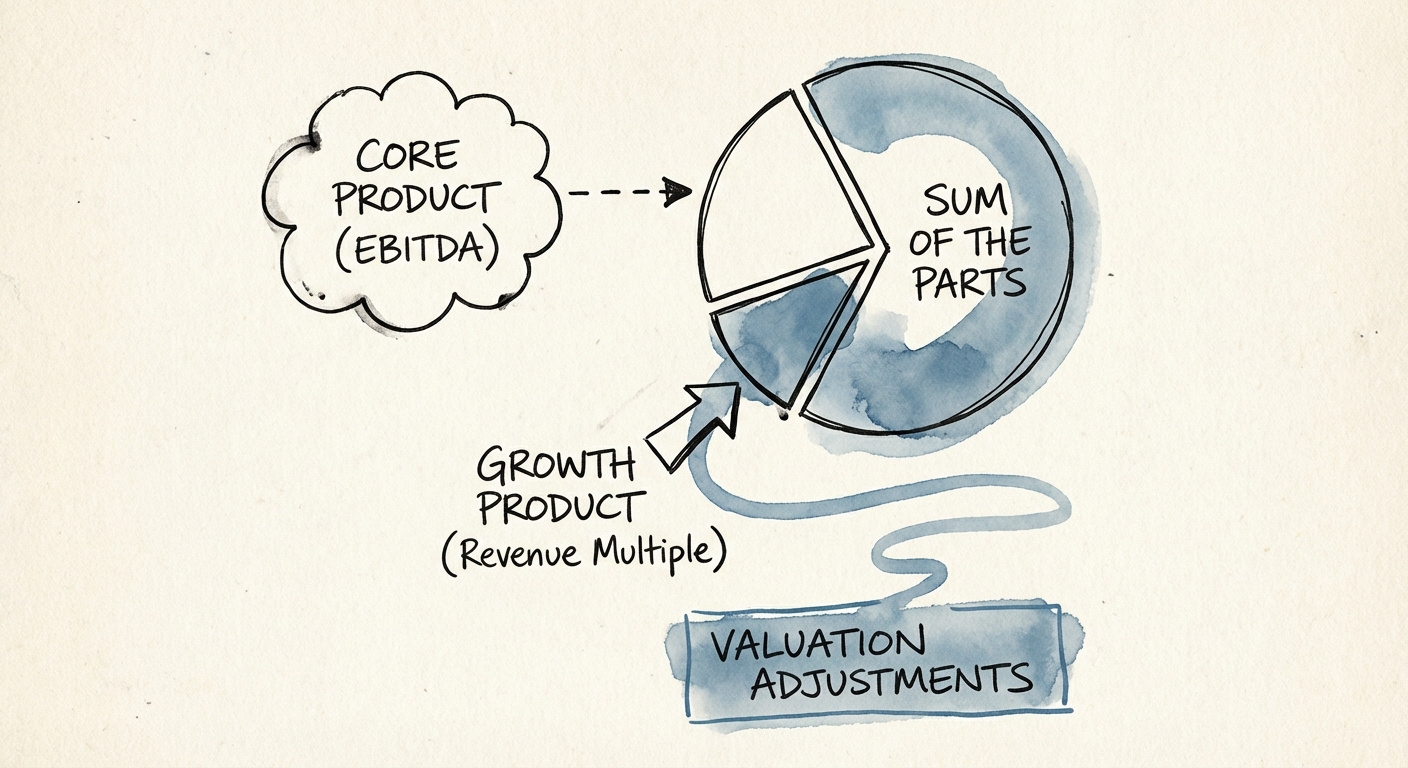
Strategic Positioning: The 'Sum of the Parts' Defense
When preparing for exit, do not present a blended P&L. A blended view often hides the high performance of your core product behind the investment drag of your new product. Instead, use a Sum of the Parts (SOTP) analysis to defend your valuation.
Step 1: Segment the P&L
Create pro-forma P&Ls for each product line. Allocate shared costs (G&A, Shared R&D) based on revenue contribution or headcount, but clearly isolate direct costs.
- Core Product: Show the "Cash Cow" profile—high EBITDA margins (30%+), moderate growth. This commands a profitability multiple.
- Growth Product: Show the "Venture" profile—high growth (50%+), break-even or loss-making. This commands a revenue multiple.
Step 2: Calculate the 'Synergy Add-Back'
Quantify the value of the platform. Explicitly calculate the savings generated by your multi-product model compared to running two standalone companies. This might look like:
- "Shared R&D Infrastructure Savings: $2.5M"
- "Cross-Sell CAC Savings: $1.8M"
Presenting these as "structural advantages" rather than just EBITDA adjustments helps buyers see the Platform Premium as tangible cash flow potential. Refer to our guide on The Weighted Rule of 40 to see how to balance these growth and profitability profiles in your final valuation model.
Ultimately, a multi-product strategy is a double-edged sword. Handled poorly, it dilutes focus and value. Executed with rigorous product roadmap discipline, it creates the inescapable gravity that defines category leaders.