The practical answer
- Short answer
- Discover how LTV:CAC ratios impact SaaS valuation multiples in 2026. Learn the diagnostic framework to calculate true unit economics and command a 30-50% premium.
- Best fit
- Industry: B2B SaaS. Function: Finance & Strategy
- Operating path
- Exit Readiness → Operational Excellence → Transaction Advisory Services
- Key metric
- 30% Valuation premium for SaaS companies maintaining an LTV:CAC ratio > 5:1 compared to peer averages.
The Unit Economics That Define Your Exit Multiple
In 2021, investors paid for growth. In 2026, they pay for efficient growth. The era of "growth at all costs" has been replaced by a disciplined focus on unit economics, specifically the relationship between Customer Lifetime Value (LTV) and Customer Acquisition Cost (CAC). Our analysis of recent private equity deal flow indicates a bifurcation in the market: companies with an LTV:CAC ratio above 5:1 are commanding a 30-50% premium on revenue multiples compared to their peers.
This premium exists because LTV:CAC is the ultimate proxy for capital efficiency. It tells a buyer exactly how much enterprise value you create for every dollar of sales and marketing spend. A ratio of 3:1 is no longer the "gold standard"—it is merely the survival baseline. To exit at a premium (8x-12x ARR), you must demonstrate that your revenue engine is not just growing, but compounding efficiently.
The "Weighted Rule of 40"
While the traditional Rule of 40 (Growth + Profitability) remains relevant, PE firms are increasingly applying a "weighted" lens where efficient growth (high LTV) trumps raw growth. If your LTV is low due to high churn or low gross margins, even 50% year-over-year growth will not save your valuation. Buyers will discount your ARR because the cost to maintain that revenue is too high. You can evaluate your standing with our ARR Multiple Calculator to see where you truly land.
A ratio of 3:1 is no longer the gold standard—it is the survival baseline. To exit at a premium, you must demonstrate that your revenue engine is not just growing, but compounding efficiently.
The "LTV Hallucination": Why Your Calculation Is Wrong
Most founders believe they have an LTV of $100k+, but when we open the data room, the real number is often half that. This discrepancy—what I call the "LTV Hallucination"—is the primary reason deals get re-traded in due diligence. The error almost always stems from two specific variables in the LTV formula.
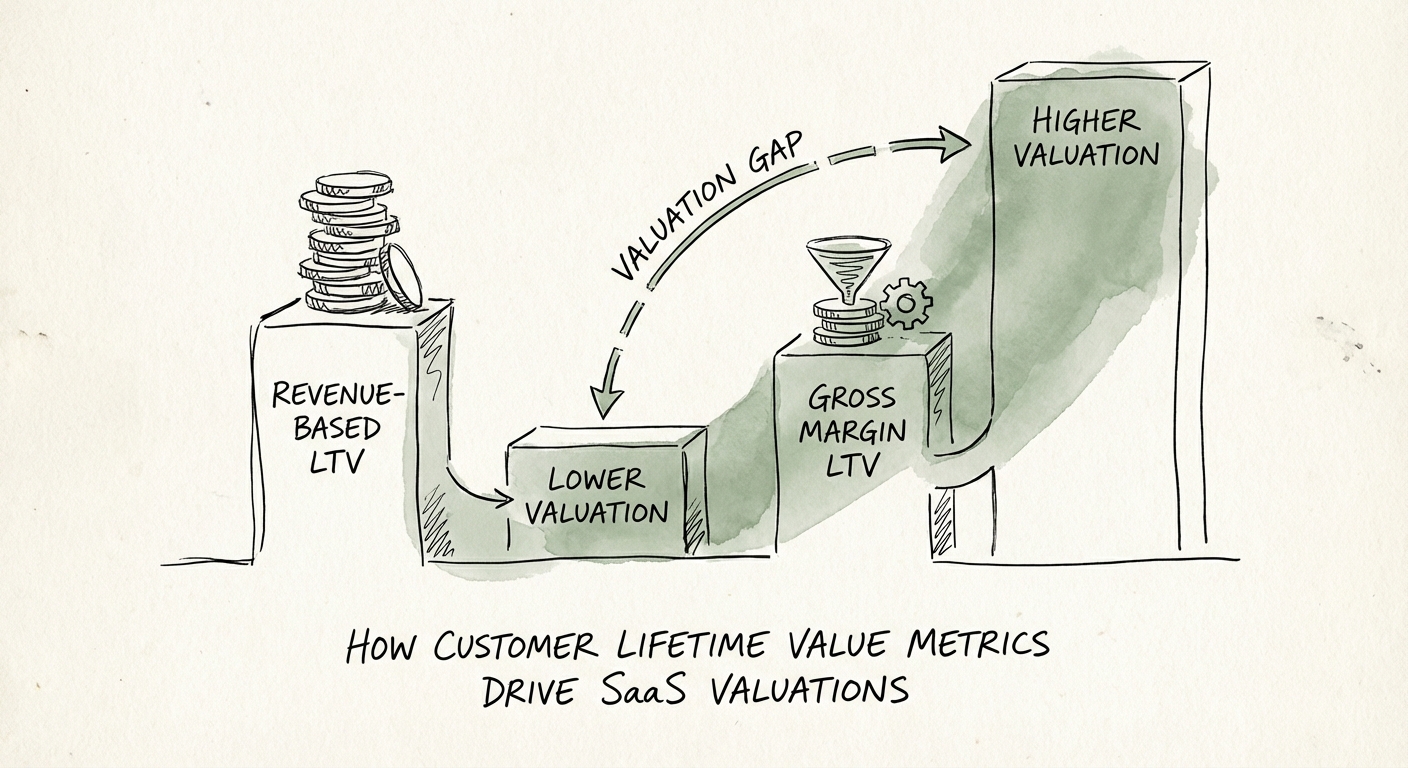
1. The Gross Margin Trap
Founders frequently calculate LTV using revenue rather than gross profit. This is fatal. If your ACV is $50k but your gross margin is only 65% (due to heavy hosting costs or implementation staffing), your actual value per customer is $32.5k, not $50k. PE buyers calculate LTV based on contribution margin. If you present a revenue-based LTV, you aren't just wrong; you look unsophisticated.
2. The Churn Denominator Fallacy
The second error is using Net Revenue Retention (NRR) instead of Gross Revenue Retention (GRR) in the denominator. If your NRR is 110%, calculating churn as (1 - NRR) suggests you have negative churn, which mathematically implies an infinite LTV. This is financially impossible. For valuation purposes, buyers use Gross Dollar Churn to determine the lifespan of a customer cohort. High expansion revenue helps your valuation, but it does not extend the theoretical lifespan of a churning logo. You must audit your retention metrics using the correct NRR vs. GRR formulas to avoid this trap.
2026 Benchmarks: Calibrating for the Exit
To position your firm for a premium exit, you need to benchmark against the top quartile of private SaaS performers. In 2026, the median private SaaS company generates approximately $130,000 in ARR per FTE, but top performers in the $50M-$100M range are pushing $200,000 per FTE. This efficiency feeds directly into LTV by reducing the service delivery cost assigned to each customer.
The Payback Period Correlation
There is an inverse correlation between CAC Payback Period and LTV multiples. While 12-18 months is acceptable, companies achieving a 9-month payback are seeing outsized valuations. This speed of capital recycling allows you to grow faster with less dilution—a key metric for PE sponsors looking to inject growth equity. If your payback period is creeping above 18 months, your LTV is likely eroding due to the time value of money.
Ultimately, your LTV metrics are a promise of future cash flow. If that promise relies on shaky math or ignored churn, the market will punish you. If it is built on high gross margins and efficient acquisition, you will name your price. Check your CAC Payback validity before you sign the LOI.