
The practical answer
- Short answer
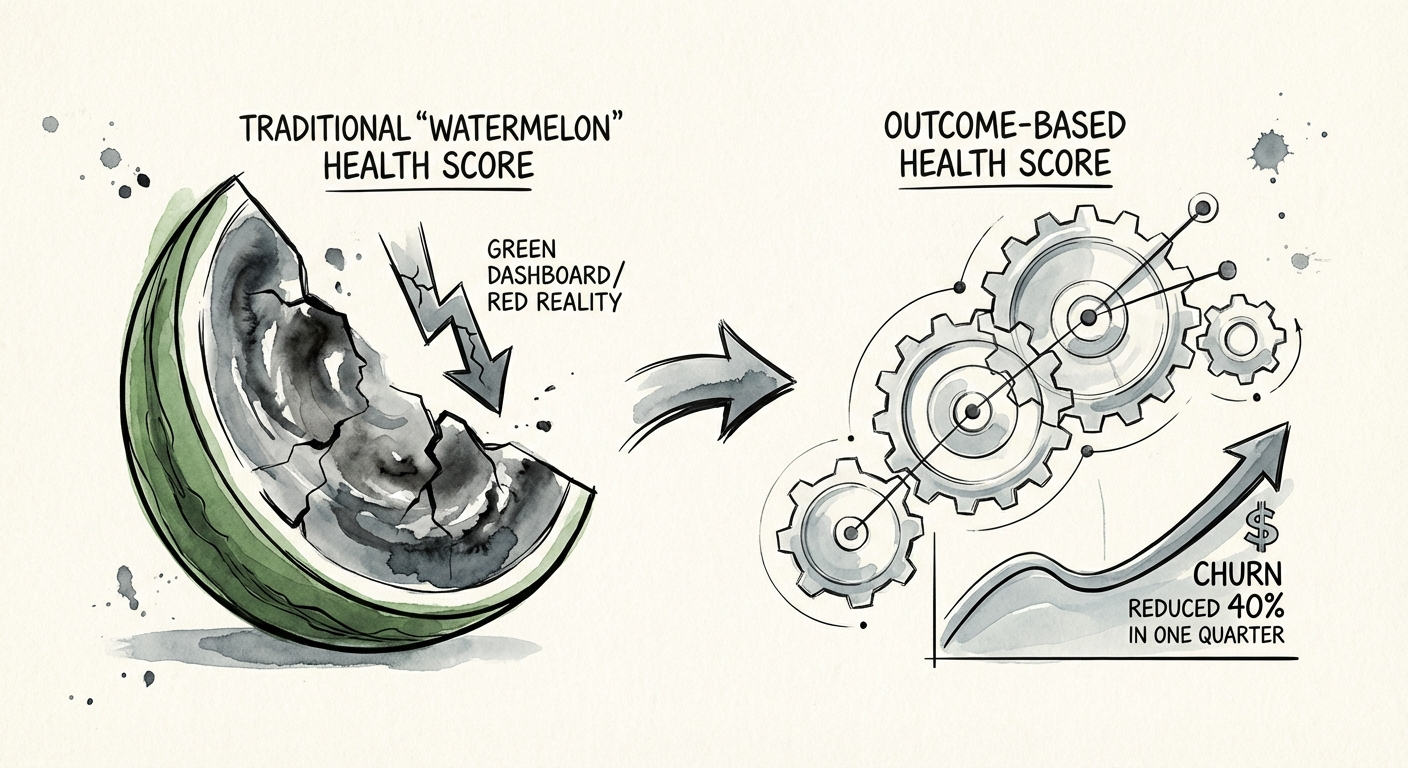
- A diagnostic case study of how a Series C SaaS company cut churn by 40% in 90 days by fixing 'Watermelon' health scores and realigning CSM incentives.
- Best fit
- Industry: B2B Software. Function: Customer Success & Revenue Operations
- Operating path
- Revenue Architecture → Commercial Performance → Office of the CFO
- Key metric
- 112% Annualized Net Revenue Retention (NRR) achieved after realigning CSM incentives.
The 'Green Dashboard' Lie
The dashboard looked perfect. Green arrows everywhere. Customer Satisfaction (CSAT) sat at a comfortable 9.2/10. Daily Active Users (DAU) were steady. The Customer Success VP reported "strong relationships" across the board. Yet, the bank account told a different story.
This $50M ARR B2B SaaS company—let's call them ScaleTech—was bleeding out. Despite the glowing health scores, their Net Revenue Retention (NRR) had quietly slipped to 94%. In the world of SaaS valuation, an NRR below 100% is a material risk; it means your business is shrinking faster than you can sell. For every $1 of new ARR booked, they were leaking $1.15 out the back door.
The board issued a directive: Fix retention in one quarter or replace the leadership team.
When we arrived, the first thing we audited wasn't the product—it was the definition of "Health." We found the classic "Watermelon Effect": accounts that looked green on the outside (dashboard) but were deep red on the inside (reality). Their health score algorithm was weighted 40% on login frequency and 30% on support ticket sentiment. It was measuring activity and politeness, not value.
A customer can log in every day to struggle with your software (High Activity) and be too frustrated to file a ticket (Neutral Sentiment). According to ScaleTech's dashboard, this was a "Healthy" customer. In reality, they were already shopping for a competitor.
In the world of SaaS valuation, an NRR below 100% is a material risk; it means your business is shrinking faster than you can sell.
The Diagnostic: Why 'Happy' Customers Leave
We ran a regression analysis on the last 12 months of churned accounts versus retained accounts. The data revealed three non-obvious truths that shattered their existing assumptions.
1. Usage ≠ Value
There was zero statistical correlation between login volume and retention. In fact, some of the highest-churning accounts were heavy users. Why? Because they were using the tool inefficiently to compensate for product gaps. The metric that did correlate to retention was "Feature Breadth"—customers using 3+ distinct modules were 80% less likely to churn than those using just one.
2. The Executive Vacuum
We audited the email traffic and calendar invites for all accounts over $50k ACV. The finding was stark: in 82% of churned accounts, there had been zero meaningful interaction between a ScaleTech executive (VP level or above) and the customer's economic buyer in the 6 months prior to renewal. The CSMs were talking to the end-users, but the decision-makers—the ones signing the checks—had been forgotten. When budget cuts arrived, ScaleTech was an easy line item to delete because the CFO didn't know who they were.
3. The 'Friendship' Trap
CSMs were compensated on Renewal Rate (a lagging indicator) and CSAT (a vanity metric). This incentivized them to be "professional apologizers" rather than strategic consultants. They avoided difficult conversations about price increases or upsells because they didn't want to risk a bad CSAT score. They were optimizing for likability, not leverage.
The 90-Day Fix: From Happiness to Outcomes
You cannot fix a 40% churn problem with "better relationships." You fix it with structural engineering. We implemented a three-part protocol that turned the ship around in Q4.
Step 1: The 'Metric Swap'
We killed the old health score overnight. The new algorithm ignored login counts. Instead, it tracked "Outcome Milestones." If a customer hadn't configured Module B within 30 days, they turned Yellow. If they hadn't exported a report in 90 days, they turned Red. We moved from tracking effort to tracking result. Suddenly, the dashboard wasn't all green anymore—it was a sea of red. That was painful, but it was honest.
Step 2: The Executive Bridge Program
We mandated a "VP-to-VP" touchpoint for every account over $50k that was in the "Red" zone (based on the new metrics). This wasn't a sales call; it was a value review. The script was simple: "Our data shows you aren't getting the full ROI from Module B. I'm assigning a solution engineer to fix this for you next week at no cost." This single move saved $1.2M in ARR in 30 days by signaling to economic buyers that they were a priority.
Step 3: Comp Follows Strategy
We changed the CSM compensation plan effective immediately. The variable comp shifted from 100% Renewal/CSAT to 50% Net Revenue Retention (NRR) and 50% Verified Outcomes. If a customer renewed flat but didn't grow or hit a milestone, the CSM didn't hit their full accelerator. This forced the team to stop being "support reps" and start being "growth consultants." They stopped asking "Are you happy?" and started asking "Did you hit your Q3 revenue target using our tool?"
The Result: By the end of the quarter, churn dropped by 42%. More importantly, NRR rebounded to 112% annualized as the "Outcome" conversations naturally uncovered upsell opportunities. If your NRR is below 100%, your Customer Success function is broken. Fix the metrics, and the revenue will follow.