
The practical answer
- Short answer
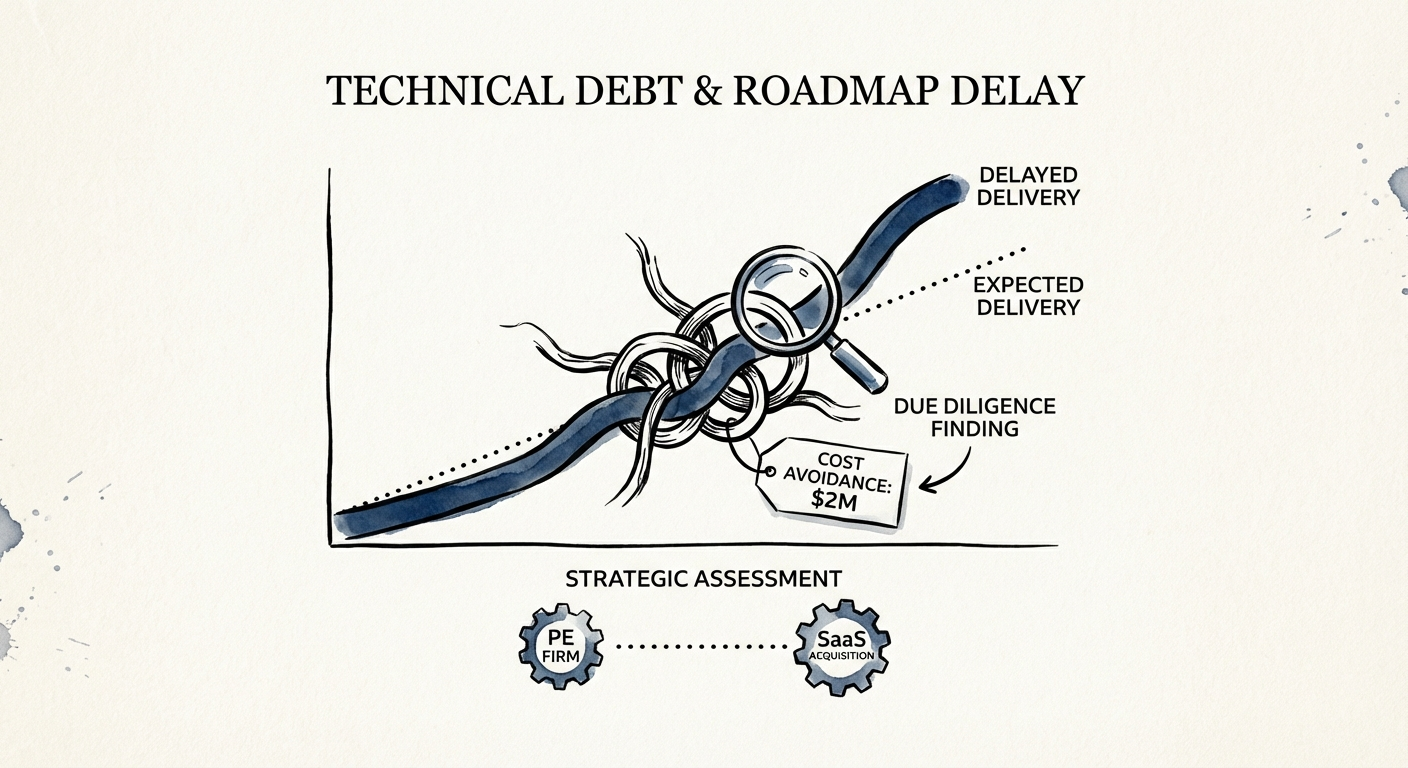
- A logistics SaaS looked clean at 8x ARR. The billing engine told a different story. How reading the code re-traded the price down $2M before close.
- Best fit
- Industry: Private Equity. Function: M&A Operations
- Operating path
- Technical Debt → Turnaround & Restructuring → Transaction Advisory Services
- Key metric
- 33% of developer time in the target company was wasted on 'churn'—rewriting code shipped <3 weeks prior.
The QofE was clean. The routing engine was a five-year-old time bomb.
Picture the deal: a B2B logistics SaaS, $12M ARR, growing 20% a year, holding a 25% EBITDA margin. An add-on for an existing platform, priced at an 8x multiple. The Quality of Earnings report came back clean. Sales pipeline validated. Legal flagged a couple of minor IP items and nothing else. Every workstream gave a green light except the one that actually generates the revenue: the software.
And the software was a black box. IT diligence on most mid-market software deals is a PDF questionnaire. Do you use AWS? Is there a DR plan? Are you SOC 2? The CTO types "yes" three times and the deal advances. That checklist describes the infrastructure the product runs on. It tells you nothing about the asset you are buying — the code itself. In a logistics platform, the asset is the routing and billing engine, and that is exactly the part a questionnaire never opens.
We told the buyer to stop reading answers and start reading commits. The founders pushed back hard — predictable from a team that knows which closet is messy — but eventually granted read-only repository access. Five days later the "perfect" deal looked very different, and the buyer was holding the leverage instead of the seller.
A clean QofE tells you the revenue is real. It says nothing about whether the thing generating that revenue can survive the roadmap you just paid for. Read the code, or finance the rewrite out of your own EBITDA.
Three numbers that turned engineering complexity into a price adjustment
Our 5-day technical due diligence was not a hunt for pretty code. Growing companies don't have pretty code, and you shouldn't pay extra expecting it. We were hunting for one specific thing: financial liability wearing an engineering costume. Three measurements did the work.
1. Complexity concentrated exactly where the valuation lived
We mapped the codebase and isolated the routing-and-billing engine — the core IP underwriting the 8x. The React frontend was fine, modern, well-organized. It was also a decoy. The backend that prices and dispatches shipments carried a cyclomatic complexity north of 50. Past 15 a module is hard to maintain; past 30 it is dangerous to touch. This was a thicket of nested conditionals written years earlier by a founder who had since stopped coding, and nobody on the current team fully understood it. The practical translation: any new feature wired through that engine would take roughly three times the industry norm to ship. The seller's roadmap — the one justifying the growth thesis — was not optimistic. It was arithmetically impossible.
2. A third of payroll spent un-shipping last month's work
The git history doesn't negotiate. Over the trailing six months, 33% of developer time went to rewriting code that had shipped less than three weeks prior. That is not iteration; it is a team running on a treadmill of self-inflicted breakage from a fragile architecture. McKinsey puts tech debt at up to 40% of an IT estate's value; here it was eating a third of the engineering payroll every single month, and the QofE had quietly counted that bloated payroll as a normal operating cost.
3. A four-year-old dependency the future SOC 2 audit would never pass
The dependency scan found critical libraries that hadn't been patched in four years, several carrying known high-severity CVEs sitting in the authentication path. Bringing the platform to the buyer's security bar — and through the SOC 2 audit they'd need for enterprise logistics customers — meant a real refactor of the auth layer, not a version bump. These are the red flags that quietly kill deals after close instead of before. With IBM pegging the average breach at $4.88M, the buyer was about to inherit that exposure at no charge.
We didn't hand over a report. We handed over an invoice.
"The code is bad" is a complaint, and sellers ignore complaints. A remediation cost is a line item, and sellers concede line items. So we priced the work required to stabilize the asset before it could carry the growth plan the buyer was paying for:
- Refactor the billing/routing engine: 3 senior engineers for 6 months ≈ $450K. This is the engine; it cannot be growth-deferred.
- Auth-layer security remediation: a 2-month all-hands sprint to clear the CVEs and survive the SOC 2 audit ≈ $300K.
- Roadmap delay: the new enterprise module slips from Q1 to Q3 while the team pays down debt — ≈ $1.35M in deferred revenue and missed synergy capture.
Quantified impact: roughly $2.1M.
The buyer carried that breakdown to the table and never once argued about code quality — a fight he'd lose to a defensive founder. He argued CapEx. He framed the debt as deferred maintenance, the software equivalent of a building inspector finding a roof that needs replacing in 18 months. You don't walk from the house. You adjust the offer. The seller conceded, and the purchase price came down $2M to fund the engineering work the platform needed on day one.
The deal didn't change shape. It got de-risked. The buyer's first-100-days remediation budget was now funded by the seller's proceeds, not his own fund's capital — and his post-close EBITDA wasn't quietly bleeding into a rewrite nobody had budgeted for.
What this means for your next add-on
Stop accepting codebases as black boxes, especially in operationally dense products like logistics, payments, or scheduling where the engine is the company. The discipline is simple: put a dollar figure on the technical debt and price it into the deal. Stripe's research shows how much engineering capacity vanishes into maintenance — capacity you are paying full multiple for. You will never find perfect code. The win isn't perfection. It's making the seller pay for the imperfections instead of you discovering them in month four.