
The practical answer
- Short answer
- Learn how to quantify technical debt in dollar terms to adjust pre-acquisition pricing. A diagnostic guide for PE sponsors to prevent post-close margin erosion.
- Best fit
- Industry: Private Equity. Function: Investment Committee
- Operating path
- Technical Debt → Turnaround & Restructuring → Transaction Advisory Services
- Key metric
- 33% Of developer time is spent fixing bugs and managing technical debt rather than building new features (CISQ).
The Off-Balance-Sheet Liability Killing Your Multiple
Most Private Equity sponsors treat technical debt as an engineering nuisance—something the new CTO will clean up post-close. This is a fundamental error in valuation. Technical debt is not a code quality issue; it is a financial liability that accrues interest in the form of higher maintenance costs, slower feature releases, and increased security risk. In the current vintage, it is the single largest unpriced risk in software M&A.
Consider the data. According to McKinsey Digital, technical debt now amounts to 20-40% of the entire value of a company's technology estate. If you are acquiring a SaaS platform for $100M, you are effectively inheriting a $20M to $40M liability that does not appear on the balance sheet. This liability manifests immediately post-close as the "Innovation Tax." Research from CISQ indicates that developers spend approximately 33% of their time dealing with technical debt rather than building new features. In a portfolio company with a $10M engineering payroll, that is $3.3M of annual OpEx wasted on maintenance—a direct hit to EBITDA that should be factored into your valuation model.
The goal of pre-acquisition technical due diligence (TDD) must shift from "identifying red flags" to quantifying specific dollar-value adjustments. You need to convert "spaghetti code" into a CapEx requirement that justifies a purchase price reduction or a specific escrow holdback.
Technical debt is the only off-balance-sheet liability that you buy at full price and pay interest on every single day post-close. If you aren't quantifying it in the LOI, you are overpaying.
Three Methods for Quantifying the "Code Discount"
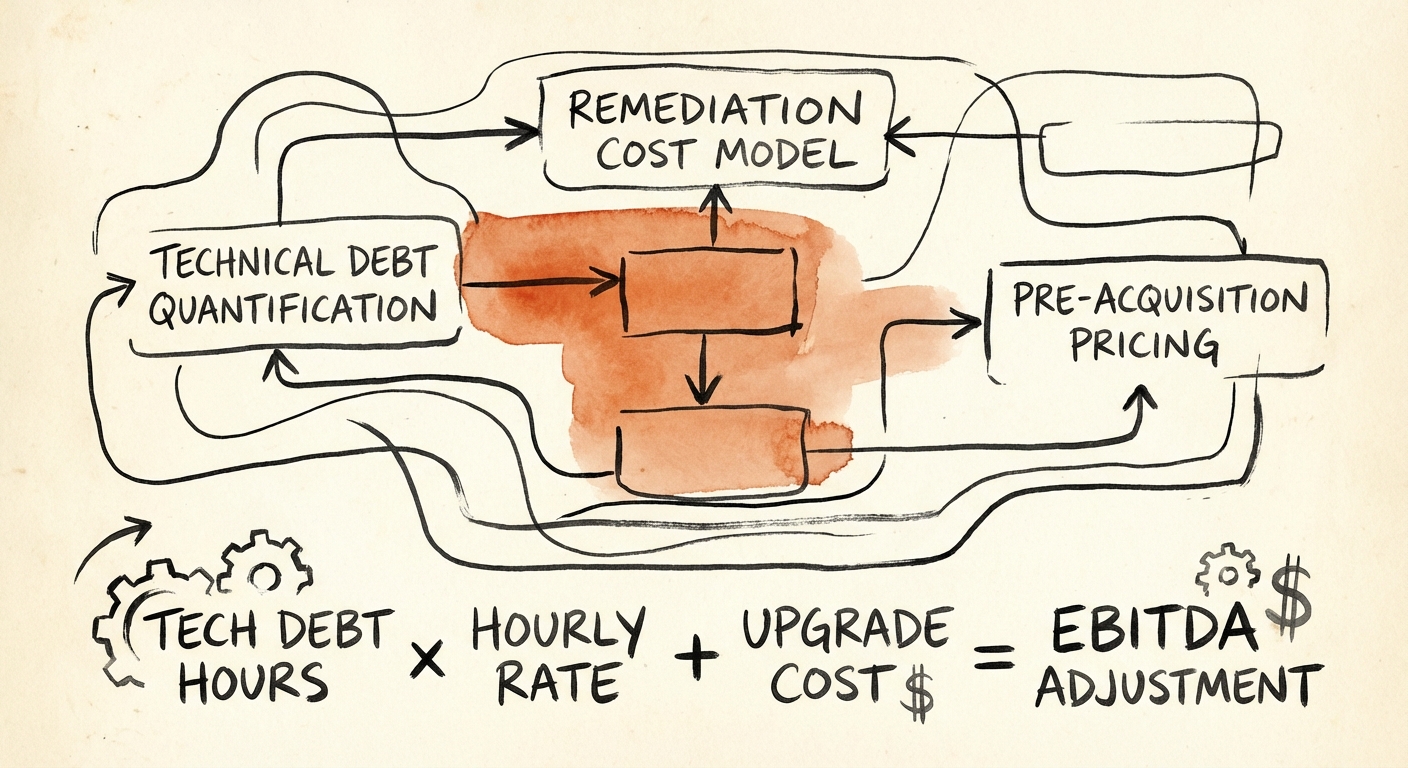
1. The Remediation Cost Model (The CapEx Adjustment)
This method treats technical debt as deferred maintenance on a physical asset. Just as you would deduct the cost of a new roof from a real estate purchase, you must deduct the cost of rewriting critical systems. To calculate this:
- Identify "High Severity" issues (e.g., hardcoded credentials, lack of automated testing, monolithic dependencies).
- Estimate the engineering hours required to remediate these specific issues to an industry-standard baseline.
- Apply a blended hourly rate (e.g., $150/hr for senior contract engineers).
Benchmark: Industry data suggests a remediation cost of approximately $3.61 per line of code for severe violations. For a codebase with 100,000 lines of legacy debt, this is a quantifiable $361,000 immediate liability.
2. The Maintenance Burden Model (The OpEx Adjustment)
This method adjusts the target's projected EBITDA based on the "interest payments" on their technical debt. If the target claims their R&D team will deliver three major features next year, but their Technical Debt Ratio is 40%, their actual capacity is significantly lower.
Calculation:
(Total Engineering Payroll) x (Tech Debt Ratio - Industry Average of 15%)
= EBITDA Adjustment
.
If a target spends $5M on engineering and has a 35% debt ratio (vs. a 15% healthy benchmark), you are overpaying by $1M annually in labor efficiency. This $1M should be deducted from their EBITDA add-backs or projected growth efficiency.
3. The Time-to-Market Discount
Heavily indebted codebases move slower. Gartner predicts that through 2025, technical debt will consume more than 50% of IT budgets for organizations that fail to manage it. If the investment thesis relies on a rapid pivot or new product launch in Year 1, you must discount the projected revenue from that launch by the "drag factor" of the code. We typically see a 6-9 month delay in product roadmaps for companies with severe architectural debt.
Executing the Re-Trade: From Bug Report to Balance Sheet
Data alone does not lower the price; the presentation of risk does. Do not present the Investment Committee with a SonarQube report listing 5,000 bugs. They won't care. Instead, present a Technical Liability Schedule.
Your LOI or purchase agreement should utilize this quantification to structure protective provisions:
- Specific Indemnity: For identified security vulnerabilities (e.g., open source license violations or unpatched libraries), require specific indemnification separate from the general basket.
- Remediation Escrow: If the Technical Due Diligence reveals $2M in necessary platform modernization to achieve the growth plan, request that $2M be placed in escrow, releasable only upon completion of specific technical milestones.
- Valuation Bridge: Use the "Maintenance Burden" calculation to challenge the seller's pro forma EBITDA. If they argue their 40% EBITDA margin is sustainable, show them that 20% of their engineering spend is actually "unrecognized maintenance," making their true adjusted EBITDA significantly lower.
Technical debt is not abstract. It is a borrower against future cash flows. The most successful PE firms in 2026 will be those that learn to price this debt before they buy it.