
The practical answer
- Short answer
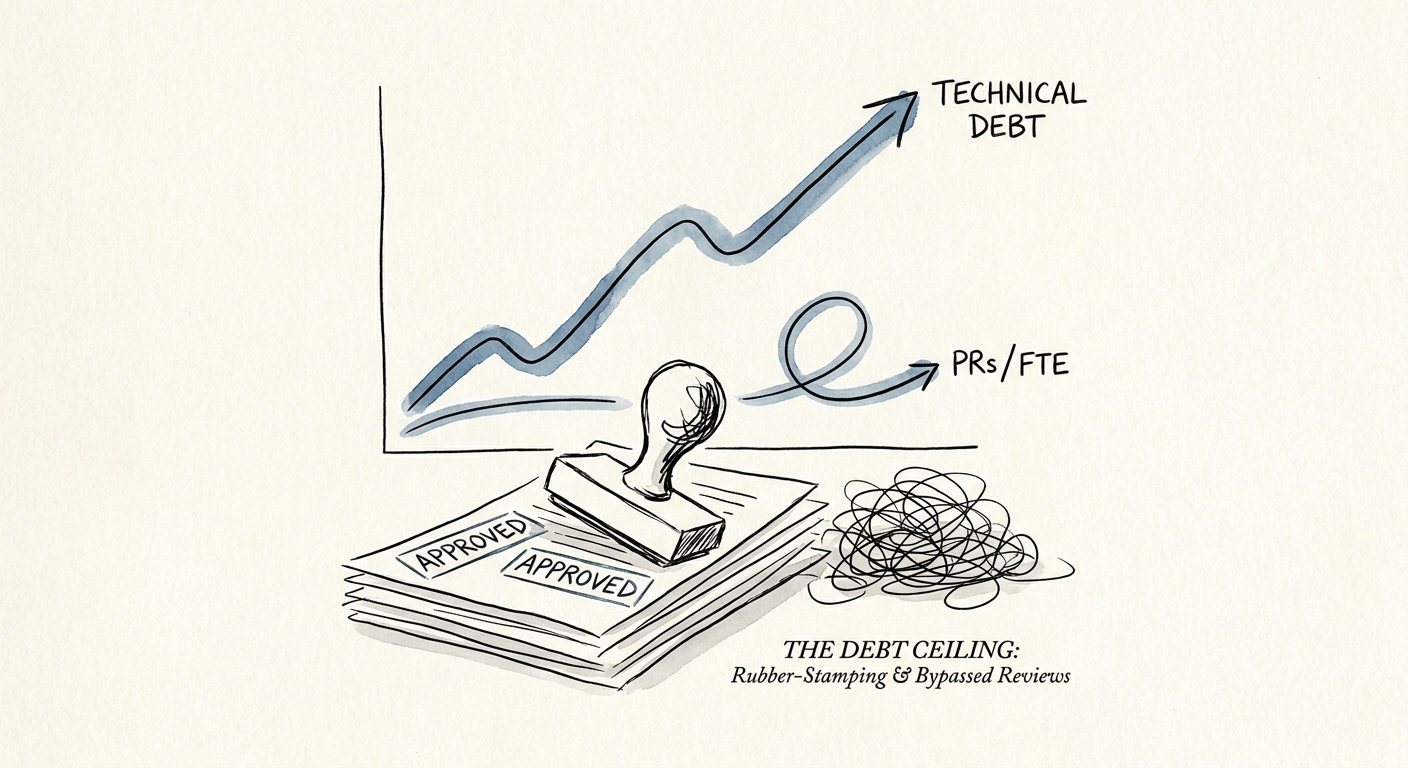
- Why measuring PRs merged per FTE is a vanity metric that masks compounding technical debt, destroys engineering productivity, and kills SaaS exit multiples.
- Best fit
- Industry: B2B SaaS. Function: Engineering Leadership
- Operating path
- Technical Debt → Turnaround & Restructuring → Transaction Advisory Services
- Key metric
- 3 Core engineering health metrics to pair with raw throughput: cycle time, change failure rate, and MTTR.
Pull requests merged per FTE can be a useful operating signal, but it is dangerous as a standalone productivity metric. For years, venture-backed boards have asked for raw output metrics to justify engineering payroll, and CTOs have often presented "PRs merged" as proof of velocity. When that number becomes the target, teams can slice work into tiny commits, rush reviews, and optimize for visible throughput over durable software.
In a recent operating review of a scale-up engineering organization, the raw PR count looked strong. The deeper review told a different story: test coverage was not keeping pace, architectural ownership was unclear, and the bug backlog was growing faster than feature output. The team was shipping, but the operating system behind shipping was weakening.
This volume-first approach breaks the unit economics of software development. You pay the engineer to write code once, but you pay the organization to maintain, debug, secure, and change it for years. If you want to know how much capacity is already compromised, establish clear technical debt percentage benchmarks before your next board meeting.
Productivity is not how fast you type; productivity is how securely you scale. Optimizing for merge velocity directly cannibalizes system resilience.
The Problem with Throughput-Only Engineering Metrics
When you measure PRs per FTE in isolation, you can create pressure for shallow approvals. Engineers know throughput is visible, so reviews can drift toward syntax checks instead of architectural validation. A PR that should receive careful review gets approved quickly, and the organization inherits the complexity later.
The financial impact shows up as unplanned rework: hotfixes, regressions, production incidents, and slow feature delivery caused by earlier shortcuts. You do not need to abandon delivery metrics. You need to pair them with quality metrics, including change failure rate, automated test coverage, defect escape rate, review depth, and cycle time. The goal is not slower engineering; the goal is reliable throughput.
High-performing teams use DORA-style measures to connect delivery speed with operational stability. They understand that one well-reviewed change to a core billing module can create more enterprise value than dozens of superficial changes. PRs-per-FTE treats all code as equal, which is the core mistake.
Re-aligning Engineering Economics for M&A
If you are a founder or CEO preparing for a private equity exit, your engineering metrics will be reviewed during technical diligence. Acquirers do not stop at raw output. They look at the structural integrity of the asset they are buying. A high PR count coupled with a growing bug backlog, weak test coverage, and unclear architecture is a red flag. It signals that post-acquisition stabilization may require capital, time, and senior engineering attention.
The right response is to transition away from throughput counting as the headline metric and toward a balanced operating dashboard. Stop asking only how many tickets closed. Ask whether cycle time improved, whether change failure rate stayed controlled, whether review quality improved, and whether technical debt as a percentage of engineering capacity is falling. For a broader framework, read why common productivity metrics can mislead boards.
To fix this, instrument your organization to track cycle time, change failure rate, and mean time to restore as a unified triad. Cycle time measures end-to-end efficiency from first commit to production deployment. Change failure rate captures the quality of releases. MTTR shows whether the team can recover quickly. Productivity is not how fast you merge; productivity is how reliably you scale.