
The practical answer
- Short answer
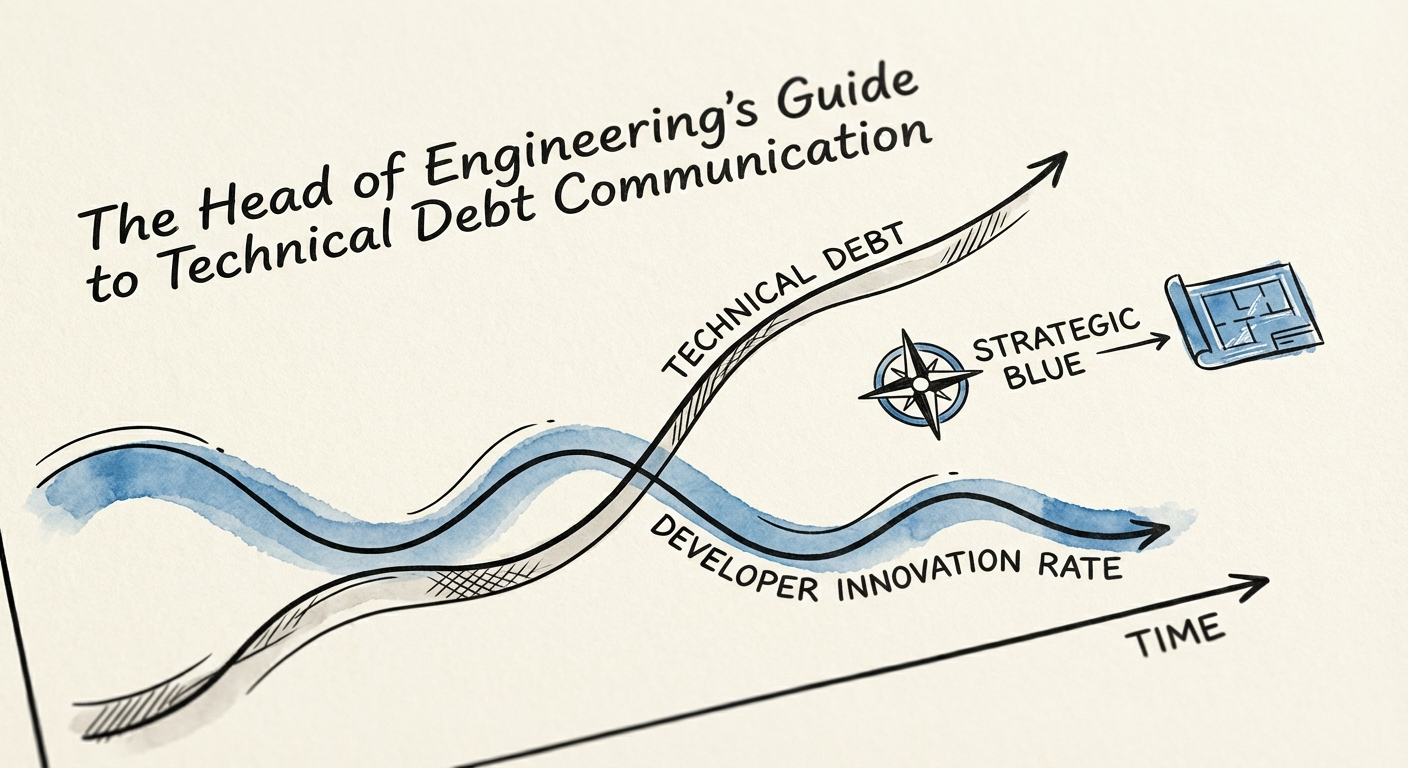
- Stop talking about 'refactoring' and start talking about EBITDA. A guide for Engineering Leaders to translate technical debt into business risk for CEOs and Boards.
- Best fit
- Industry: B2B SaaS & Tech Services. Function: Engineering Leadership
- Operating path
- Technical Debt → Turnaround & Restructuring → Transaction Advisory Services
- Key metric
- 42% Developer time lost to technical debt and bad code maintenance (Stripe).
The Translation Gap: Why Your CEO Hates the Word "Refactoring"
Here is a scene that plays out in boardrooms across the B2B SaaS landscape every quarter. The Head of Engineering presents a roadmap update. It is red. Features are slipping. The explanation? "We need to pause feature development for a sprint to refactor the legacy codebase."
To an engineer, this is a responsible request. It is akin to changing the oil in a car. But to a founder, board member, or PE Operating Partner, this sounds like: "I want to stop doing my job (building value) to polish the tools I use to do my job."
The problem isn't the work; it is the vocabulary. When you say "Technical Debt," your non-technical stakeholders hear "abstract developer complaint." They do not see it on the Balance Sheet. They do not see it in the P&L. Therefore, it does not exist until it causes an outage.
You must stop speaking fluent Code and start speaking fluent EBITDA. Technical debt is not a code quality issue; it is an off-balance-sheet liability that levies a high-interest tax on your velocity. According to our frameworks for board presentations, you must frame debt in terms of risk and opportunity cost.
Stripe’s Developer Coefficient report explicitly states that 42% of developer time is lost to "bad code" and technical debt. If you have a $5M engineering payroll, you aren't just "struggling with legacy code"—you are lighting $2.1M on fire annually. That is the language that gets a budget approved.
If you can't quantify your technical debt in dollars or days of delay, it doesn't exist to your Board. You are just a cost center complaining about the work.
The "Debt Ceiling" Framework: Quantifying the Drag
To win the argument for a paydown strategy, you need numbers, not feelings. Most engineering leaders rely on DORA metrics (Deployment Frequency, Lead Time for Changes), which are excellent for internal optimization but often fail to land with a CFO. Instead, you need to calculate your Innovation Rate versus your Maintenance Tax.
McKinsey research suggests that technical debt amounts to 20-40% of the value of your entire technology estate before depreciation. If your platform has $10M in invested code value, you are carrying a $2M-$4M liability. This liability charges interest in the form of slower shipping speeds. Gartner data supports this, showing that companies actively managing technical debt ship at least 50% faster than those that don't.
How to Calculate Your Interest Rate
We advise Engineering Heads to present a simple "Debt Ceiling" slide to the board:
- Principal: The estimated cost to remediate critical components (e.g., $500k).
- Interest Rate: The percentage of sprint capacity currently consumed by bugs/fixes related to this debt (e.g., 30%).
- The Cost of Inaction: If we don't pay down the principal, we effectively reduce our team size by 30%. On a 20-person team, that is 6 headcount wasted.
When you present it this way, the decision becomes financial, not technical. Does the CEO want to hire 6 more engineers to get the same output, or spend one month fixing the engine so the existing 20 can run at full speed? For more on prioritizing which debt to pay down first, see our guide on prioritizing technical debt remediation.
The Board-Ready Playbook: Asking for the "Paydown Sprint"
Never ask for a "grand rewrite." In the history of software, few phrases have destroyed more value than "we need to rewrite it from scratch." It implies a black hole of capital with no incremental deliverables. Instead, structure your request as a Velocity Unlock Project.
Your proposal should look like a standard investment memo:
- Problem: "Our billing service fragility is causing a 3-day delay on every release."
- Solution: "A targeted 4-week modernization of the billing module."
- ROI: "Will reduce release overhead by 60%, unlocking 400 developer-hours per year (equivalent to $60k in savings + faster time-to-revenue)."
This approach aligns perfectly with PE value creation plans. You are not asking for permission to code; you are proposing a capital improvement project with a defined return. By documenting this process, you also increase the asset's value at exit. As we cover in our technical debt benchmarks, acquirers heavily scrutinize this "off-book" liability during due diligence. A clean codebase isn't just easier to work in; it commands a higher multiple.
Your job as Head of Engineering is not just to protect the code; it is to protect the business from the code. Make the invisible visible, and you will find your CEO becomes your biggest ally in the war against debt.