
The practical answer
- Short answer
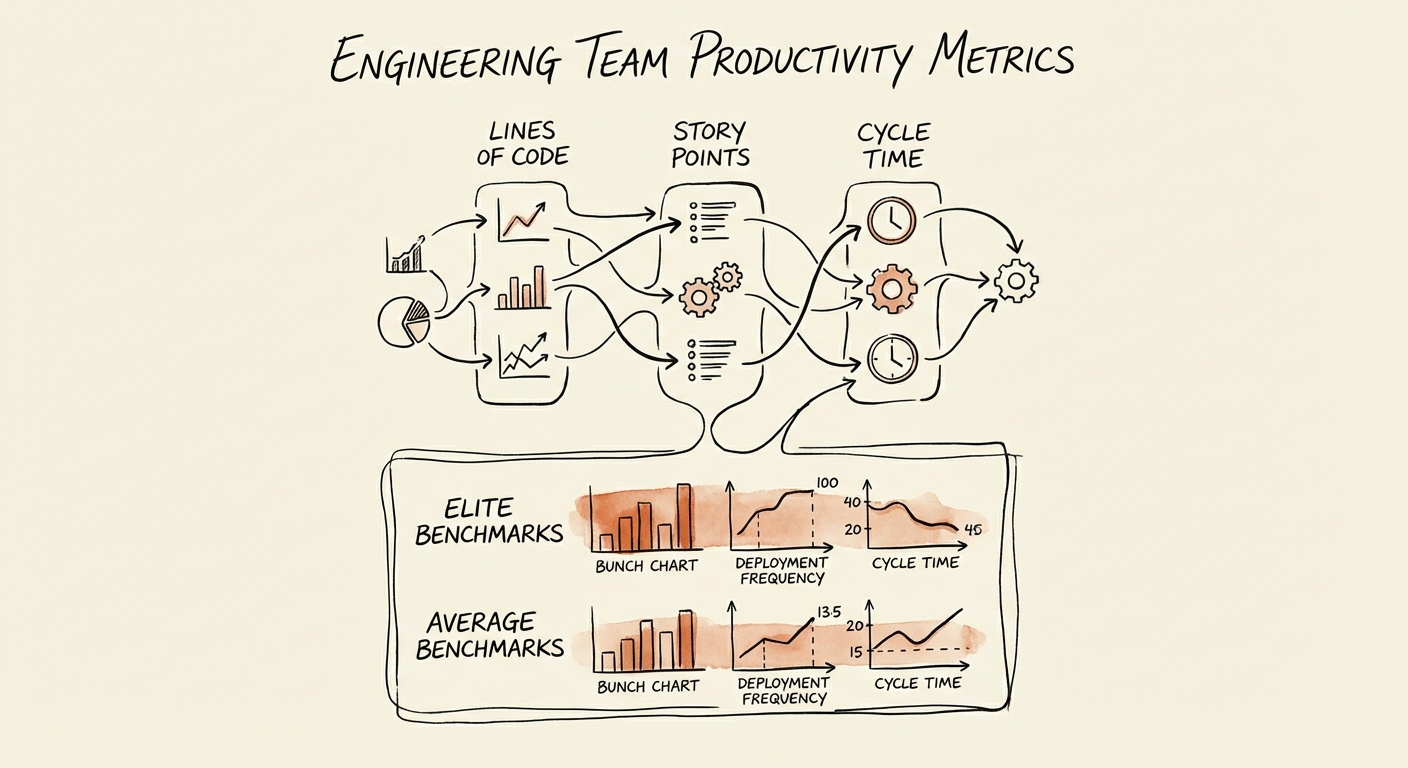
- Stop measuring engineering activity. Start measuring flow. Compare Lines of Code, Story Points, and Cycle Time with 2025 benchmarks for PE-backed teams.
- Best fit
- Industry: B2B SaaS. Function: Engineering Management
- Operating path
- Technical Debt → Turnaround & Restructuring → Transaction Advisory Services
- Key metric
- 2.6x Higher revenue growth reported by teams with Elite DORA metrics compared to low performers.
The Vanity Metric Trap: Lines of Code and Story Points
In the boardroom, engineering often feels like a black box. You pour capital in, and features come out... eventually. To bridge this visibility gap, founders and operating partners often grasp at the easiest available metrics: Lines of Code (LoC) and Story Points (Velocity). Both are dangerous proxies for value.
The "Weight" of Code
Measuring productivity by Lines of Code is, as the old adage goes, like measuring aircraft building progress by weight. It rewards bloat and inefficiency. In 2025, with the rise of AI-assisted coding tools like Copilot, an engineer can generate thousands of lines of boilerplate code in minutes. If LoC is your metric, you are incentivizing your team to prioritize verbosity over elegance and maintainability. You aren't measuring productivity; you are measuring technical debt creation.
The Inflation of Story Points
Story Points are equally misleading when used as a performance metric. They were designed for capacity planning, not productivity tracking. Points are relative estimates of complexity, unique to each team. When leadership uses "Velocity" (points completed per sprint) as a KPI, teams inevitably succumb to Goodhart's Law: when a measure becomes a target, it ceases to be a good measure. The result is "Story Point Inflation." A task that was 3 points in Q1 becomes 5 points in Q3, creating the illusion of increased velocity while actual output remains stagnant. You get a "green" dashboard, but your roadmap delivery dates keep slipping.
Measuring software productivity by lines of code is like measuring progress on an airplane by how much it weighs.
The Truth Metrics: Cycle Time and DORA
If activity metrics are the lie, Flow Metrics are the truth. For PE-backed companies where capital efficiency is paramount, the focus must shift from "how busy is the team?" to "how fast does value reach the customer?"
Cycle Time: The Speedometer of Value
Cycle Time measures the elapsed time from the first code commit to production deployment. It captures the friction in your entire system—code review delays, CI/CD bottlenecks, and QA queues. According to 2025 benchmarks from LinearB and DORA research, the gap between elite and average teams is widening:
- Elite Teams: < 26 Hours
- Good Teams: 26 - 80 Hours
- Average Teams: > 80 Hours
A Cycle Time under 26 hours is not just a vanity stat; it is a leading indicator of revenue quality. Elite performers report 2.6x higher revenue growth because they can iterate on customer feedback faster. If your Cycle Time is 7 days, your feedback loop is broken, and you are building features in a vacuum.
Deployment Frequency & PR Size
Cycle Time is supported by two diagnostic metrics: Deployment Frequency and Pull Request (PR) Size. Elite teams deploy on demand (multiple times per day), ensuring that risk is distributed across small, manageable changes. In contrast, low-performing teams deploy once every two weeks (or months), turning every release into a high-stakes event prone to failure. Large PRs (>200 lines) are the primary driver of high Cycle Time, as they clog the code review process and increase the likelihood of bugs.
The Board-Ready Dashboard
Stop reporting "Sprints Completed" or "Jira Tickets Closed" to your Board. These metrics invite micromanagement without offering insight. Instead, present a Software Delivery Performance dashboard that links engineering health to business outcomes.
The 3 Metrics That Matter to Investors
- Cycle Time (Speed): Are we getting faster or slower at shipping value? If this is trending up, you have a process bottleneck or a technical debt problem.
- Change Failure Rate (Quality): What percentage of deployments cause a hotfix or rollback? Elite teams maintain a <5% failure rate even while deploying daily. A spike here indicates you are trading stability for speed.
- R&D Allocation (Investment): Where is the effort going? Track the split between New Features, KTLO (Keep the Lights On), and Unplanned Work. If "Unplanned Work" exceeds 20%, your roadmap is a fiction.
By shifting the conversation to these metrics, you align engineering with the investment thesis. You aren't just "writing code"; you are building a predictable, efficient engine for asset appreciation. In a market valuing EBITDA growth over "growth at all costs," this predictability is the premium that drives exit multiples.