The practical answer
- Short answer
- You went from 15 to 30 engineers and shipped 20% more. Here's the issue-tracker math that turns "the code is messy" into a board-ready capacity number.
- Best fit
- Industry: B2B SaaS. Function: Engineering
- Operating path
- Technical Debt → Turnaround & Restructuring → Transaction Advisory Services
- Key metric
- 33% Of developer time is spent on maintenance & tech debt (Stripe)
The math that doesn't add up after a Series B
Here's the conversation I've had with three different founder-CEOs in the last year, almost word for word. They raised a Series B, executed the plan, and took engineering from 15 people to 30. They budgeted for roughly double the output. The next quarter's roadmap shipped maybe 20% more than the quarter before the hires landed.
So the CEO asks the CTO what happened. And the answer is always some combination of three words: "onboarding," "complexity," and "rewrite." All three are real. None of them is a number. You can't put "complexity" on a board slide, you can't allocate against it, and you certainly can't decide whether to keep hiring based on it.
The thing nobody told you when you closed the round is that your codebase has a carrying cost, and it scales with size, not headcount. Stripe's Developer Coefficient report put a hard figure on it: developers lose roughly 13.5 hours a week — about a third of a working week — to maintenance and bad code. When you doubled the team, you didn't just double the output capacity. You also added thirty people's worth of new code to a base that was already taxing the original fifteen. Some of your new hires are now servicing debt the day they finish onboarding.
The reason this hits at Series B specifically is that you're past the stage where one person held the whole system in their head and not yet at the stage where the architecture is hardened. The codebase is big enough to be expensive and young enough that nobody refactored it on the way up. That's the gap where capacity quietly evaporates.
A CTO saying "we have tech debt" is a feeling. A CTO saying "11 of our 30 engineers are funded entirely by maintenance tickets" is a number you can act on in the next board meeting.
Deriving the number from data you already have
You don't need a code audit or a consultant crawling your repos to get this. The number is sitting in your issue tracker right now. Pull a rolling 90-day window from Jira or Linear and split every closed ticket into two buckets.
- Build: tickets that created new product capability — features, net-new functionality, things a customer could notice.
- Carry: tickets tagged Bug, Refactor, Maintenance, Tech Debt, or "investigate why X broke" — work that exists only because the system isn't clean.
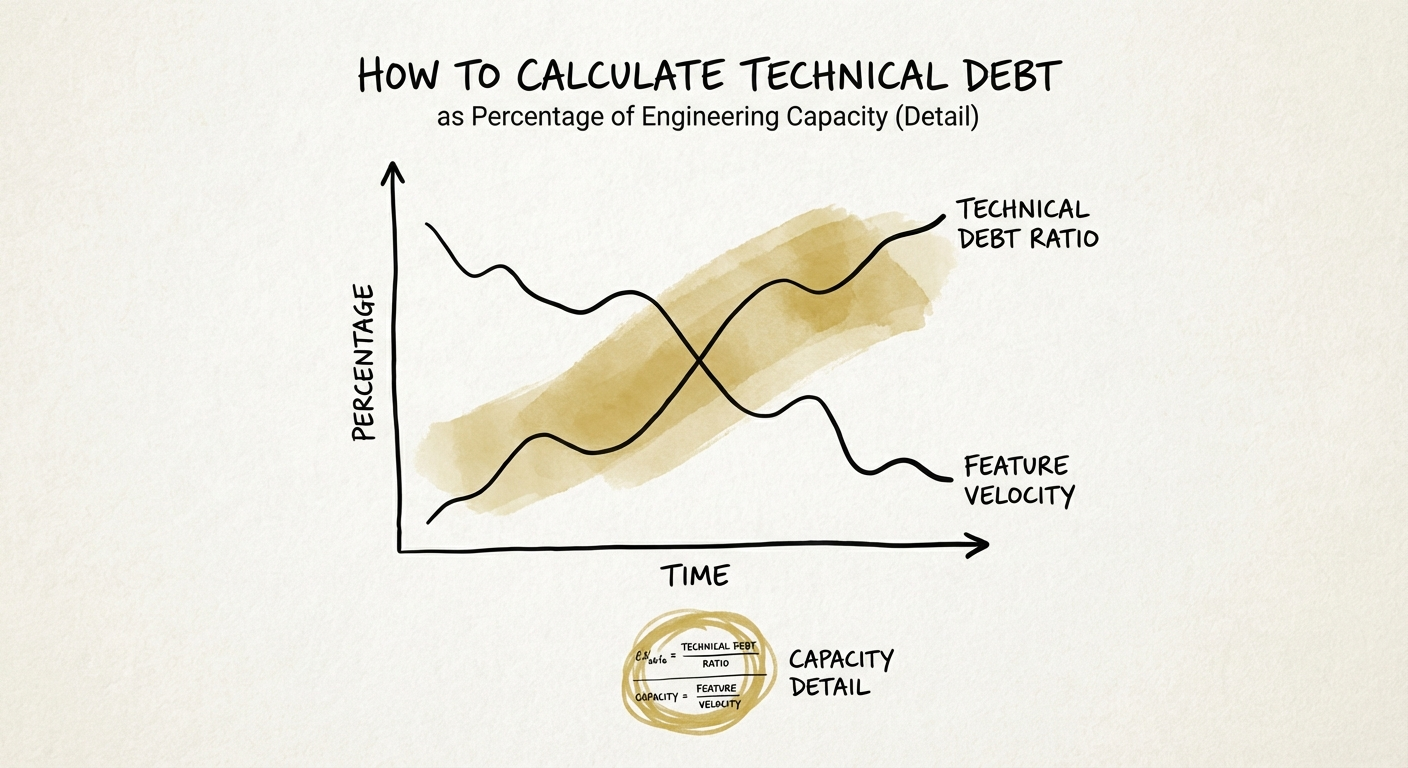
The ratio is the carry hours (or story points) divided by total engineering hours, times 100. That percentage is the share of your capacity going to keep the lights on rather than move the business forward. McKinsey's Developer Velocity research is blunt about why this matters: the companies that manage this well don't just feel cleaner, they meaningfully out-deliver peers on the same headcount.
One trap to watch when you run this for the first time: if the number comes back suspiciously low — under 10% — that's almost never good news. CodeScene's analysis of the business costs of technical debt shows how the worst remediation work hides inside feature estimates. The engineer pads a two-day feature to five days because three of those days are spent wrestling a file nobody dares touch. Your tracker says "feature." Reality says you spent 60% of that ticket carrying debt. So before you trust the ratio, spot-check a handful of your padded feature tickets and ask the engineer where the time actually went.
Zero is also wrong, in the other direction. A team reporting 0% carry is either lying, over-engineering everything before release, or moving slowly enough that debt hasn't surfaced yet. The useful reading sits in a band: somewhere around 15–20% is the deliberate, healthy cost of keeping a growing system maintainable. Once you're north of 40%, you're in the spiral — new work breaks old work, the people who can fix it are the people who want to leave, and adding engineers just adds future carry.
Now translate the percentage into the language your board speaks. A 30-person team running 40% carry means twelve engineers' worth of capacity is funding maintenance. Drive that to 20% and you've reclaimed six engineers without a single req opening. That's not a cost-cutting story — it's the highest-ROI capacity you can recover this year, and it doesn't go through recruiting.
What to do with the number on Monday
Once you have a real percentage, the question stops being "do we have debt" and becomes "what carry rate are we choosing to run." That's a resource-allocation decision, which is squarely your job. Three moves convert the number into a managed line item.
Fund the carry on purpose. Reserve a fixed slice of every sprint — call it 20% — for refactoring, test coverage, and debt paydown, and protect it the way you protect a customer commitment. The reason teams stay above 40% isn't that they don't know they have debt. It's that paydown is always the work that gets sacrificed when a deadline slips. If it's a budgeted allocation rather than "when we have time," it survives the crunch.
Get the accounting right. Talk to your CFO about which of this work is genuinely extending the useful life of the asset versus routine upkeep. Major architectural work can sometimes be capitalized rather than expensed, which changes how the spend reads on your P&L — worth structuring deliberately rather than discovering at diligence.
Make it visible at the file level. The rule that actually stops debt compounding: when an engineer opens a messy file to ship a feature, the estimate includes cleaning up that specific file. You're not asking for a heroic rewrite quarter. You're asking that the system get incrementally cleaner everywhere work already happens.
Run this ratio every quarter and you'll catch the inflection before it becomes a crisis — the moment where each new hire is funding maintenance instead of building. If you want the threshold detail, see our technical debt benchmarks by company stage, the dollar-value quantification framework for turning the percentage into a number acquirers respect, and the breakdown of how DevOps friction lands on your P&L. The CTO who can say "eleven of our thirty engineers are funded entirely by carry, and here's the 90-day plan to get to six" has stopped trading in adjectives. That's the conversation that justifies the next round.