The practical answer
- Short answer
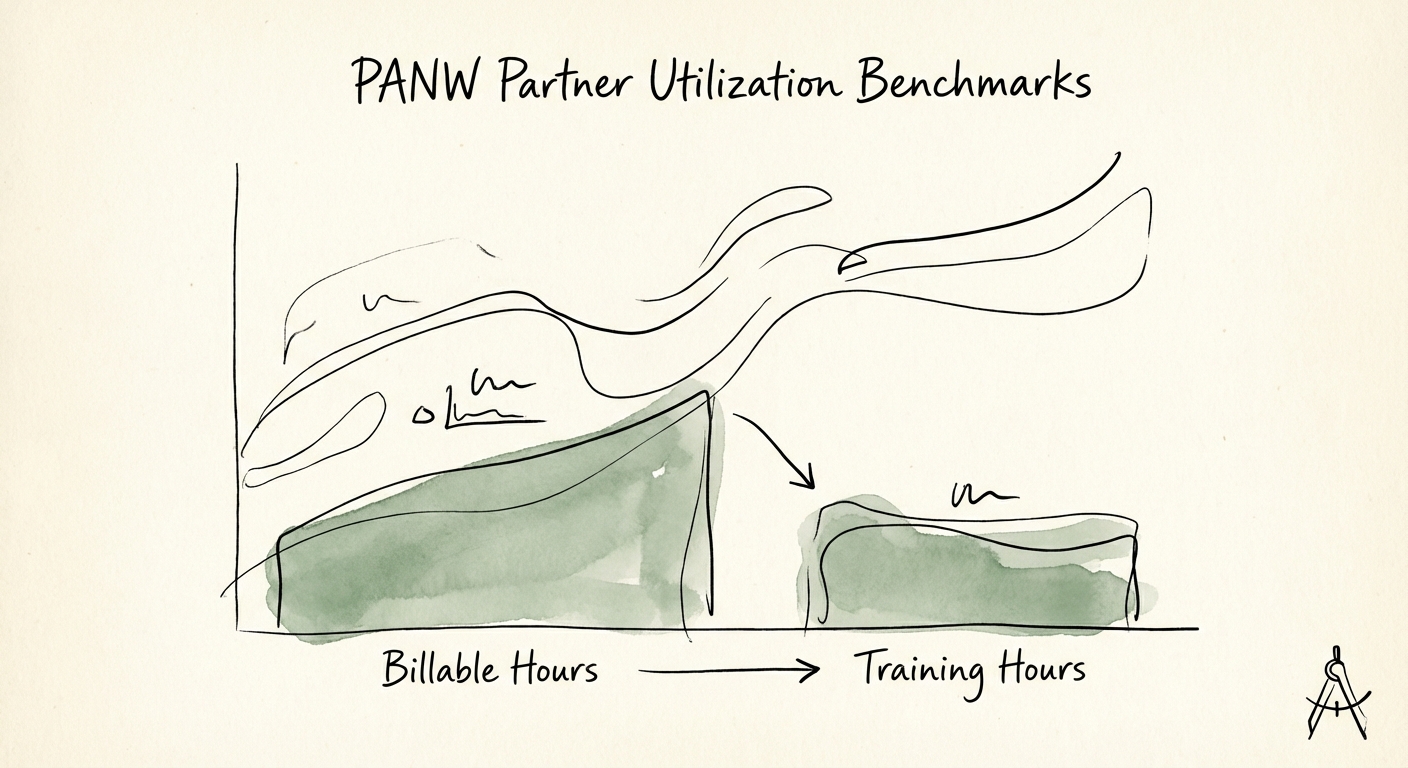
- Why chasing 85% utilization kills Palo Alto Networks (PANW) practices. New benchmarks for NextWave Diamond Innovators, Prisma SASE, and Cortex delivery teams.
- Best fit
- Industry: Cybersecurity / MSSP. Function: Professional Services Operations
- Operating path
- Unit Economics → Commercial Performance → Transaction Advisory Services
- Key metric
- 68.9% Average billable utilization for professional services firms in 2025 (down from 73% in 2021).
The 'Resale Hangover' in Services Economics
For a decade, the economics of a Palo Alto Networks (PANW) partnership were simple: Resell the hardware, attach a standard support SKU, and perhaps bill a few days of "rack and stack" installation services. In that era, professional services (PS) were often treated as a loss leader—a necessary cost to secure the hardware margin. Utilization didn't matter because the profit wasn't in the hours; it was in the box.
That era is over. With Palo Alto Networks' aggressive shift toward "platformization"—unifying network security, cloud security, and SOC automation—the value has migrated from the firewall chassis to the configuration of Prisma SASE, Cortex XSIAM, and Cloud NGS. For NextWave partners, this creates a dangerous operational trap.
Many firms attempt to apply legacy "staff augmentation" utilization targets—typically 85%—to these complex, high-value engineering roles. They assume that an engineer billing 1,700 hours a year is "efficient." In reality, a Prisma SASE architect running at 85% utilization is a depreciating asset. They are burning out, failing to maintain the rigorous certification requirements for Diamond Innovator status, and likely delivering sub-par implementations that lead to churn.
The 68.9% Wake-Up Call
According to the 2025 Professional Services Maturity Benchmark, the average billable utilization across the IT services industry has dropped to 68.9%. This isn't just a sign of market slack; it's a structural correction. As delivery complexity increases, the non-billable burden of training, solution architecture, and knowledge management rises.
For PANW partners specifically, the gap between the "85% target" and the "68.9% reality" is where EBITDA dies. If you budget for 85% and achieve 69%, you aren't just missing a bonus target; you are likely running your services division at a negative gross margin once fully loaded costs are applied. The goal for a healthy, growing PANW practice in 2026 should be a stabilized 72% for delivery staff, allowing the remaining 28% for the rigorous continuous education required by the NextWave program.
A Prisma SASE architect running at 85% utilization is a depreciating asset. They are burning out, failing to maintain Diamond Innovator requirements, and creating technical debt.
The 'Badge Tax': Why Diamond Status Kills Utilization
Achieving and maintaining NextWave Diamond Innovator status—or the newly designated Authorized Professional Services (APS) specialization—is not a "check the box" exercise. It is a continuous operational tax on your engineering capacity. Unlike legacy certifications that could be renewed every few years with a weekend of study, modern PANW specializations (PCNSE, PCNSC, PCSAE) require ongoing engagement with the ecosystem.
The Hidden Cost of Specialization
To maintain the APS designation, partners must demonstrate "world-class professional services capabilities" and undergo audits of their deployment methodologies. This requires your senior engineers to:
- Document IP: Creating and updating custom playbooks for Cortex XSOAR or migration scripts for Prisma Access.
- Lab Testing: Simulating complex customer environments to validate new PAN-OS features before deployment.
- Continuous Enablement: Keeping pace with the rapid release cycles of Prisma Cloud, which updates far more frequently than hardware firmware.
If your Senior Architect is billable 85% of the time, they have zero capacity for this work. The result is the "Paper Tiger" effect: Your firm holds the badges on paper, but your actual delivery team is uncertified or outdated, leading to failed audits or, worse, failed implementations. The "Badge Tax" is approximately 150-200 hours per year per senior engineer. If you don't factor this into your utilization model, you are effectively choosing between your margin and your partnership status.
Strategic Recommendation: The 'Blended' Utilization Model
To scale a profitable PANW practice, you must abandon the "one number for everyone" utilization target. Instead, adopt a tiered model that reflects the strategic value of the role.
1. The Delivery Tier (Target: 75-78%)
These are your L1/L2 engineers focused on execution—firewall rule migrations, standard agent deployments, and defined operational tasks. Their scope is narrower, their training burden is lower, and their billable expectation should be higher. Calculate their utilization based on pure execution hours.
2. The Architect Tier (Target: 60-65%)
These are your PCNSC-level experts. Their value is not in the hours they bill, but in the quality of the hours they oversee. They should spend 35-40% of their time on:
- Pre-Sales Engineering: Scoping complex SASE transformations to prevent fixed-fee leakage.
- Methodology Development: Building the automation assets that allow the Delivery Tier to work faster.
- Mentorship: Training the Delivery Tier to ensure the practice scales.
By lowering their billable target, you protect your IP and your Diamond status.
3. The 'Effective' Rate Metric
Stop managing solely to "hours billed." Start tracking Effective Realized Rate (Revenue / Total Hours Worked). In a fixed-fee Prisma SASE deployment, if your team works 200 hours to bill $50,000, your effective rate is $250/hr. If they "grind" for 300 hours because they didn't have time to build automation scripts, your effective rate drops to $166/hr, even though their "utilization" looks higher.
High utilization on low-efficiency work is a vanity metric. Low utilization on high-value, automated delivery is the secret to 30%+ EBITDA margins in modern cybersecurity services.