The practical answer
- Short answer
- Why 85% utilization is a trap for Splunk partners. 2026 benchmarks for Elite vs. Premier tiers, and the 'Goldilocks Zone' that drives 12x valuation multiples.
- Best fit
- Industry: Cybersecurity & Observability. Function: Professional Services Operations
- Operating path
- Unit Economics → Commercial Performance → Transaction Advisory Services
- Key metric
- 68.9% Average billable utilization across professional services in 2025 (SPI Research), well below the 85% target many firms chase.
The 'Generalist' Trap: Why 85% Utilization Kills Splunk Practices
In the world of IT staff augmentation, 85% billable utilization is the holy grail. It signals efficiency, hustle, and minimized bench time. But for a Splunk Partner aiming for Elite status or a premium exit, 85% is a material risk. It is the hallmark of a "Body Shop"—a firm trading hours for dollars on low-complexity log aggregation tasks, rather than selling high-margin security outcomes.
According to the 2025 SPI Professional Services Maturity Benchmark, average billable utilization across the industry has dropped to 68.9%, yet many founders still push their teams toward 85%. In the Splunk ecosystem, this gap is even more critical due to the technical divergence between "Core" and "Security."
The Bifurcation of the Splunk Bench
We are seeing a clear split in the market between two types of Splunk practices, each with distinct utilization profiles:
- The Log Plumbers (Commodity): These firms focus on agent deployment, data onboarding, and basic dashboarding. Their talent is interchangeable, and they run hot at 82-88% utilization. Their EBITDA margins are thin (8-12%) because they compete on rate, often billing $125-$150/hr.
- The Intelligence Architects (Premium): These firms deploy Enterprise Security (ES), build custom SOAR (Phantom) playbooks, and architect Observability pipelines. They target 72% utilization. Why lower? Because the remaining 28% is dedicated to the constant upskilling required to maintain "Elite" competency badges. They bill $225-$300/hr, resulting in higher effective yield per consultant despite lower utilization.
If you force your ES Architects to run at 85%, you leave them zero capacity to learn the latest Splunk ES updates or develop proprietary IP. The result isn't efficiency; it's attrition. You burn out your high-value assets and are left with a team that can only perform commodity work, crushing your valuation multiple.
High utilization in a specialized Splunk practice isn't a badge of honor; it's a leading indicator of attrition. If your architects are billing 40 hours a week, they aren't learning the next version of Enterprise Security.
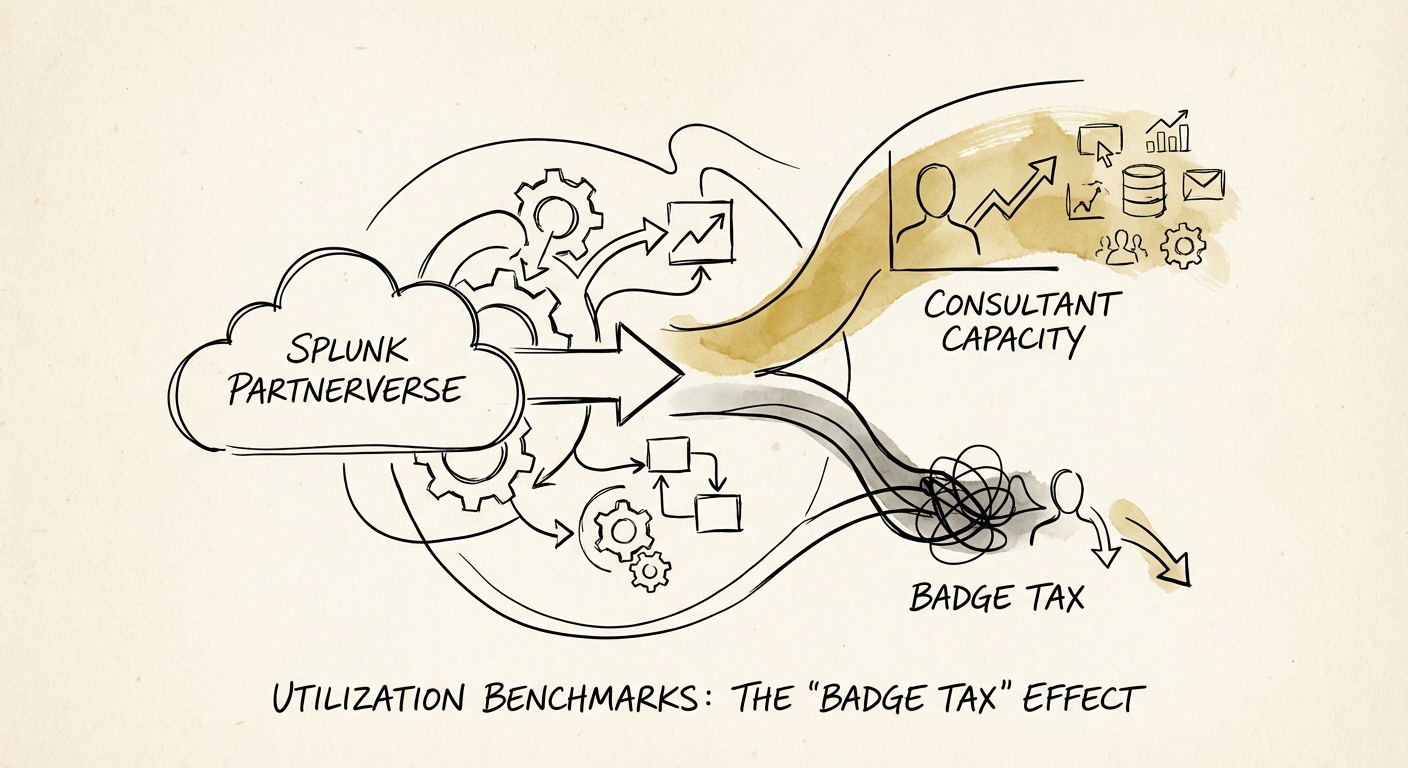
The 'Badge Tax': The Hidden Cost of Partnerverse Compliance
Splunk’s Partnerverse program is not passive. Unlike legacy programs where you could earn a badge once and coast for three years, Splunk’s requirements for Elite and Premier tiers demand active, continuous maintenance. This creates what we call the "Badge Tax" on your utilization.
To maintain Elite status in the Security or Observability motions, your team must hold a specific density of certifications (e.g., Splunk Enterprise Security Certified Admin, Splunk SOAR Certified Automation Developer). These aren't "watch a video" certifications; they require deep, hands-on lab time.
Quantifying the Shadow Bench
Our data suggests that for every 10 billable consultants, a healthy Splunk practice effectively loses 0.8 FTE annually to training and certification maintenance just to stay compliant with program tiers. If you budget for 85% utilization, you are mathematically eliminating the time required for this "Shadow Bench" activity.
When utilization creates a conflict with certification, one of two things happens:
- You lose the badge: You miss the compliance window, drop to Premier or Associate, and lose the back-end rebates and deal registration priority that drive your margins.
- You fake the badge: You force staff to cram for exams on weekends, leading to resentment and turnover. When your Lead Architect quits, they take the badge (and often the client relationship) with them.
Smart operators budget for 72% billable utilization for their senior technical staff. The "missing" 13% isn't waste; it's R&D investment. It is the time spent building the security posture assessments and migration accelerators that differentiate you from the generalists.
Valuation Impact: Why 'Efficient' Looks Like 'Risk' to Buyers
When private equity firms evaluate a Splunk partner, they don't just look at the top-line revenue; they look at the durability of that revenue. A practice running at 88% utilization is viewed as a "Red Flag" for three reasons:
- Delivery Risk: There is no slack in the system. If one project goes sideways (common in complex ES deployments), there is no one to parachute in for rescue.
- Growth Cap: You cannot sell new work because you have no capacity to start it. This "revenue ceiling" forces the buyer to factor in a 6-month hiring ramp before they can realize any growth, lowering your multiple.
- Attrition Bomb: High utilization correlates directly with high voluntary churn. Buyers will discount your EBITDA to account for the recruitment costs needed to replace the team they expect to quit post-close.
The 72% Goldilocks Zone
The most valuable Splunk partners we track operate in the 70-75% utilization range. This "Goldilocks Zone" signals to investors that you have:
- Capacity for Growth: You can start a new $500k project next week without hiring.
- Technical Depth: Your team has the bandwidth to specialize in emerging areas like Splunk Edge Processor or Mission Control.
- Sustainable Culture: You aren't burning out your talent, which protects the asset (the people) the buyer is paying for.
Stop managing for vanity metrics. 85% utilization is great for a landscaping business, but for a specialized Splunk consultancy, it's a trap. Aim for 72%, raise your rates to cover the difference, and build a practice that commands a premium valuation multiple.