
The practical answer
- Short answer
- Zendesk partners chasing Service Delivery Hours hit 85% utilization and stall at 5x EBITDA. Here's why Premier firms run at 72%, and the AI deflection math behind it.
- Best fit
- Industry: Customer Experience (CX) Consulting. Function: Professional Services Operations
- Operating path
- Unit Economics → Commercial Performance → Transaction Advisory Services
- Key metric
- 301% The ROI Zendesk claims for its AI tools, creating a 'value gap' for partners billing hourly.
The night Service Delivery Hours stopped meaning what you think
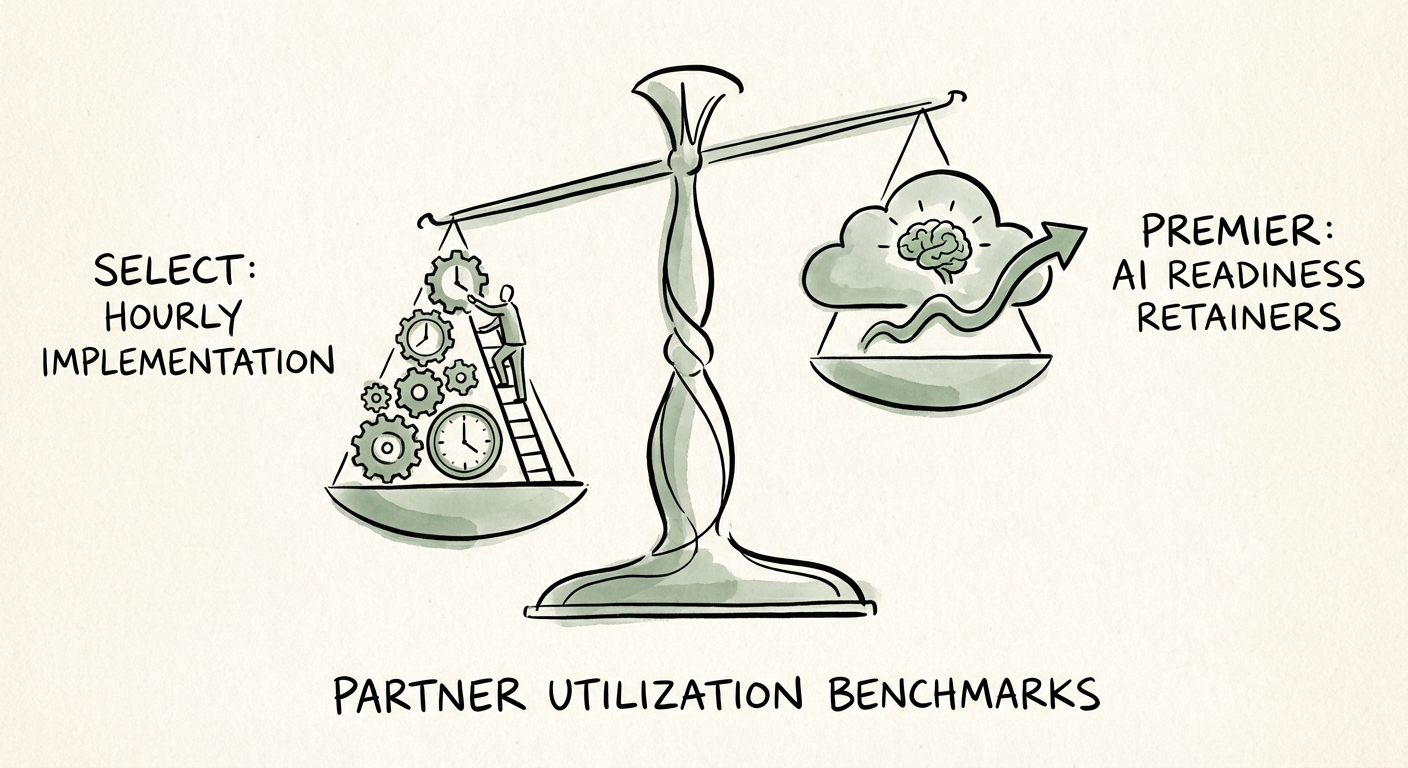
Picture the dashboard a Zendesk partner principal stares at the week before a tier review. Service Delivery Hours are short of the Premier threshold, so the reflex kicks in: load the senior architects onto every billable ticket-config job available, push utilization toward 85%, and clear the bar. It works. The tier badge renews. And it quietly caps the firm's enterprise value at 5x to 6x EBITDA for another year.
Here is the trap, stated plainly. The Zendesk partner program rewards delivered hours. The market that buys CX consultancies rewards retained revenue and rate premium. Those two scoreboards point in opposite directions, and the firms that optimize for the first one lose the second. An 85%-utilized team has zero bandwidth to learn the next thing Zendesk ships, which is exactly the thing clients will pay $300 an hour to have configured well.
Watch what separates the two archetypes I see across boutique CX firms and Zendesk-focused systems integrators:
- The body shop (85% utilization): Bills hourly for field setup, view creation, macro building, and routing logic. Net Revenue Retention stalls around 95% because once the implementation closes, there is no one with free cycles to drive adoption. Trades at 5x to 6x EBITDA, because a buyer sees a queue of one-time projects, not a franchise.
- The Premier specialist (72% utilization): Deliberately keeps 28% of senior capacity off the billable clock. That time goes to learning Zendesk AI Agents before clients ask for them, building reusable intent models for verticals like healthcare scheduling or fintech disputes, and running quarterly reviews that surface the next six-figure expansion. NRR runs near 115%. Trades at 10x to 12x EBITDA.
The 13 utilization points the second firm "loses" are not idle time. They are the R&D budget that lets the firm bill $275 instead of $175. Strip them out to hit a Service Delivery Hours target, and you have funded a tier badge by selling off the thing that actually compounds.
The moment Intelligent Triage shipped, every Zendesk partner billing for trigger configuration was selling buggy whips. Your inventory stopped being hours. It became the judgment to tune an intent model nobody else can.
Deflection is a feature for the client and a layoff notice for the billing model
For fifteen years the partner ecosystem ran on a beautiful inefficiency: a serious Zendesk rollout meant hundreds of hours of hand-built triggers, nested routing logic, and Help Center articles formatted one at a time. That manual labor was the business. Then Zendesk shipped Macro Suggestions, Intelligent Triage, and Generative Replies, and the labor evaporated.
This is the part most partners refuse to do the arithmetic on. Zendesk's own numbers, from the Forrester Total Economic Impact study, put AI-driven contact deflection as high as 25% and a 20% cut in agent handle time, against a headline 301% ROI for the buyer. Nucleus Research's analysis tells the same story from a different angle. Every one of those gains is a configuration hour the client no longer needs you to bill.
Run the deflation math on one project
Say a routing-and-triage build that genuinely took 500 hours of manual scripting two years ago. With Intelligent Triage doing the first-pass classification, that same scope is now a 150-hour engagement. If your contract is hour-based, you just watched 70% of your revenue on that project disappear, even though the value to the client went up. You are now competing to deliver a smaller invoice faster than the next partner. That is a race whose prize is a smaller invoice.
The Premier firms broke out of it by repricing what they sell. They stopped invoicing the inputs and started invoicing the result:
- The old line item: 20 hours to configure routing rules. Low rate, high volume, deflated by the next model release.
- The new line item: a fixed-fee "Intent Modeling and Tuning" engagement underwritten by a measurable deflection target. High rate, low hours, priced on an outcome the client can see in their own dashboards.
The second model demands lower utilization, because tuning an intent model and reading the resulting deflection curves is analytical work, not billable keyboard time. It also produces far higher revenue per employee. If you want to model the gap on your own P&L, our breakdown on how utilization actually drives profitability walks the numbers.
The benchmarks to audit your firm against this quarter
Hold your numbers against these figures, drawn from how high-performing boutique CX firms and specialized Zendesk SIs are operating in 2026. The point is not to copy a single target; it is to see which scoreboard your firm is currently optimizing for.
Billable utilization, senior architects
- Above 82%: the danger zone. It signals a body-shop model and predicts burnout-driven churn on exactly the people who carry your platform expertise.
- 68% to 72%: the Premier target. The headroom covers pre-sales scoping and the AI upskilling that keeps your rate card defensible.
- 75% to 78%: the realistic Select-tier band, where chasing delivery volume to clear thresholds still dominates the calendar.
Blended billable rate
- Generalist implementation work: roughly $165 to $195 an hour.
- CX strategy and AI advisory: roughly $250 to $325 an hour.
- You cannot hold the top of that range with a team booked to 85%. The strategy premium is paid for judgment, and judgment needs unbilled bandwidth to exist.
Project versus recurring mix
- Select partners: about 80% project, 20% retainer. This is the feast-or-famine pattern that makes utilization swing wildly month to month.
- Premier partners: about 45% project, 55% managed and optimization services. The recurring base smooths the utilization valleys and is precisely what an acquirer pays a higher multiple for.
The single most durable move here: attach a standing "optimization and tuning" retainer to every implementation you close, so the relationship does not end at go-live. Our look at utilization targets by role shows how to staff that without overloading your architects. And for the tier mechanics themselves, the Zendesk Partner Program guide spells out exactly which activities count toward advancement, several of which are no longer hourly.
What to do Monday: pull your senior architects' trailing-90-day utilization and your project-to-recurring revenue ratio. If utilization is north of 82% and recurring is under 30%, you are running a body shop wearing a Premier badge. The fix is not more hours. It is reserving capacity to build expertise the next model release cannot deflate, and pricing for the deflection result instead of the configuration hour.