
The practical answer
- Short answer
- New 2026 data: Why 85% utilization kills HubSpot agencies. Benchmarks for Elite vs. Gold partners, role-based targets, and the EBITDA impact of 'busy work.'
- Best fit
- Industry: Professional Services / SaaS Implementation. Function: Operations & Finance
- Operating path
- Unit Economics → Commercial Performance → Transaction Advisory Services
- Key metric
- 68.9% The average 2025 billable utilization rate, down from the historical 75% standard (SPI Research).
The 'Busy but Broke' Paradox
If you are a HubSpot Solutions Partner doing between $5M and $50M in revenue, you are likely living a contradiction: your team is slammed, your project boards are full, yet your EBITDA margin is stuck in single digits.
You look at your time-tracking software (Harvest, Toggl, or PSA tools like Kantata), and you see utilization rates hitting 85% or 90%. In the traditional agency playbook, this is a victory. In the 2026 operational reality, it is a leading indicator of margin collapse.
The 2025 SPI Professional Services Maturity Benchmark revealed a critical shift: average billable utilization dropped to 68.9% across the industry, while EBITDA margins plummeted to 9.8%. This is the "Danger Zone." However, the reaction from most founders is to push harder toward 85%+. This is a mistake.
The Three Zones of Utilization
For HubSpot Partners specifically—where delivery involves a mix of high-margin strategy and lower-margin technical configuration—the math works differently than a pure management consultancy. Here is the new reality for 2026:
- The Danger Zone (<68.9%): You are wasting cash. Your fixed costs (payroll) are eating your gross margin. This is typically caused by "scope creep" on fixed-fee retainers or poor bench management.
- The Burnout Zone (>80%): You are borrowing from the future. At 85% utilization, your team has zero capacity for "context switching," training on new Hub features, or strategic upsells. The result is a Net Revenue Retention (NRR) drop because your team is too busy delivering tickets to drive value.
- The Sweet Spot (72-78%): This is where EBITDA expansion happens. You have enough slack for innovation and account expansion, but enough tension to ensure profitability.
At 85% utilization, your agency isn't efficient—it's brittle. You are one resignation or one failed migration away from a margin collapse.
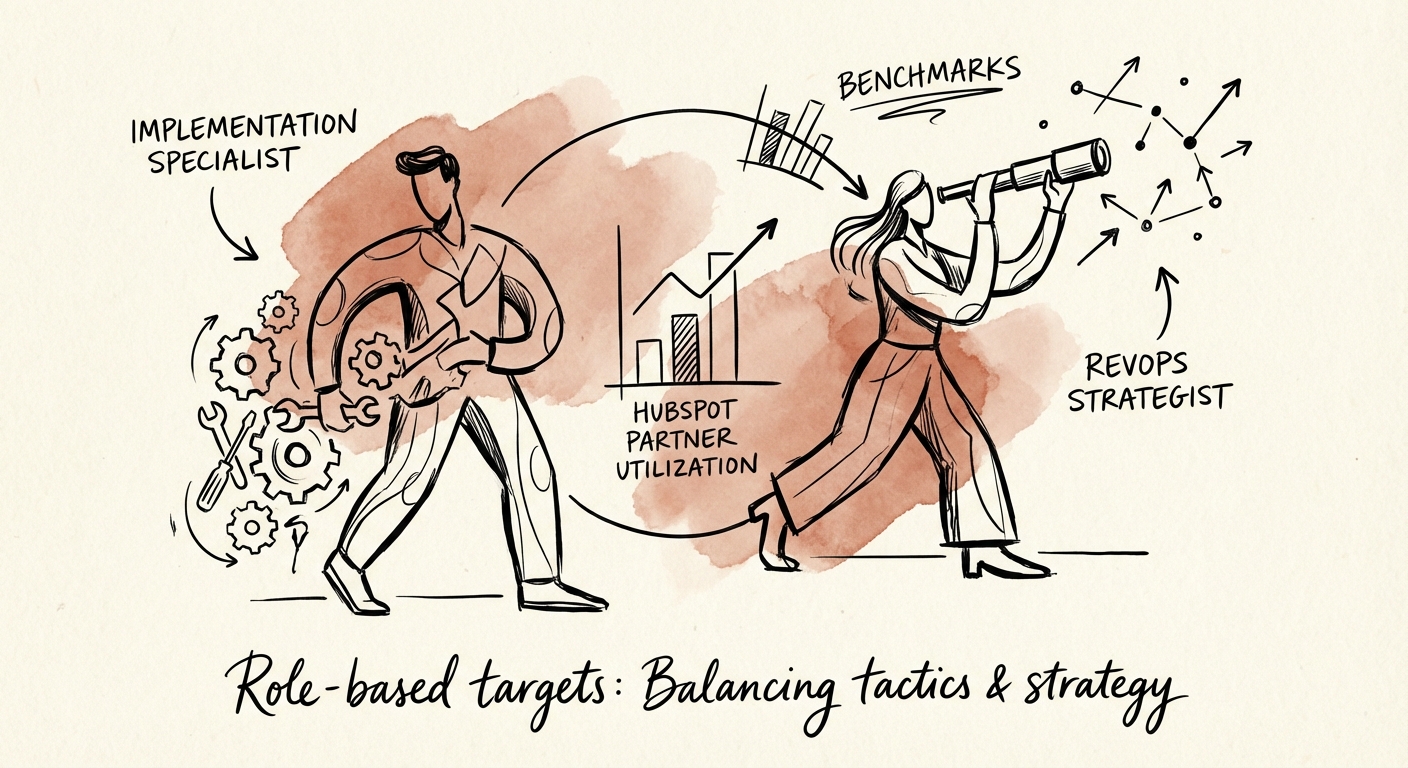
Role-Based Benchmarks: Stop Averaging Your Team
The most common mistake founders make is setting a blanket utilization target (e.g., "Everyone needs to be 80% billable"). This flattens the nuance of your delivery model and incentivizes bad behavior. A Senior RevOps Strategist billing 80% of their time is failing at their real job: growing the account.
Here are the 2026 benchmarks for high-performing HubSpot agencies (Elite/Diamond tier):
1. Implementation Specialist (The Builders)
- Target: 78-82%
- The Logic: These roles are execution-focused. Their "context switching" cost is lower. If they drop below 75%, you have a pipeline or assignment problem.
2. Solution Architect / Technical Lead
- Target: 65-70%
- The Logic: These are your "fixers." They need 30% slack to handle escalations, document complex workflows, and clean up technical debt before it kills a renewal. If you run them at 85%, your project failure rate will spike.
3. RevOps Strategist / Account Lead
- Target: 55-60%
- The Logic: This is the most counter-intuitive number. If your Strategists are 80% billable on execution, they have zero time for QBR prep, roadmap planning, and cross-selling. High utilization in this role correlates directly with lower LTV (Lifetime Value). You are paying them to think and grow the account, not just close tickets.
See our detailed breakdown of Professional Services Utilization Rate Benchmarks 2025 for a deeper dive into other roles.
The 'Utilization Lie': Billable vs. Collected
High utilization is vanity; Realization is sanity. Many HubSpot partners suffer from "The Admin Trap." Your team logs 40 hours of "billable" work, but because you sold a fixed-fee implementation for $25k and burned 300 hours, your effective hourly rate dropped to $83.
Calculating Your 'True' Yield
Stop looking at utilization in a vacuum. You must pair it with your Standard Bill Rate Realization. If your standard rate is $250/hr, but your effective yield is $160/hr due to write-offs and scope creep, increasing utilization won't save you—it will just accelerate your losses.
The Fix: Operational Engineering
- Kill the 'Blended Rate': Stop selling Implementation and Strategy at the same hourly yield. Read about the hidden margin in your delivery model.
- The 'Bench' Strategy: Elite partners maintain a "strategic bench" of 10-15% capacity. This isn't waste; it's your surge protector. It allows you to say 'yes' to a $50k change order without breaking your existing delivery team.
- Automate the Admin: If your team is spending 5 hours a week logging time or manually updating HubSpot properties for internal reporting, that's 12.5% of their utilization gone to waste.
Use our Utilization Rate Calculator to model the impact of moving your team from 85% (burnout) to 75% (profitability) by adjusting your pricing architecture rather than your hours.