The practical answer
- Short answer
- New 2026 data shows average Dynamics partner utilization has dropped to 68.9%. Discover why aiming for 85%+ is killing your EBITDA and the role-based targets you should use instead.
- Best fit
- Industry: Professional Services. Function: Operations
- Operating path
- Unit Economics → Commercial Performance → Transaction Advisory Services
- Key metric
- 68.9% Average billable utilization in 2025, a decade low for the sector.
The 68.9% Reality Check
If you are a Founder of a Microsoft Dynamics practice, you likely look at your utilization report with a mix of anxiety and frustration. You see 70% and think, "We're leaving money on the table." You push for 85%. You demand 90% from your senior architects. You think this is how you fix your EBITDA.
You are wrong.
According to the 2025 Professional Services Maturity Benchmark from SPI Research, the average billable utilization for professional services firms has plummeted to 68.9%, down from a peak of nearly 75% in previous years. Simultaneously, EBITDA margins across the sector have compressed to a decade-low of 9.8%.
The instinctive reaction for a leader like you is to crack the whip. If you are doing $15M in revenue with 40 consultants, increasing utilization from 70% to 80% looks like free money. In reality, pushing your firm-wide average above 80%—specifically in the complex Dynamics ecosystem—is a leading indicator of two things: employee burnout and project failure.
Why? Because Dynamics 365 implementations (F&O or Business Central) are not widgets. They require high-context problem solving. When you force your Senior Architects to bill 90% of their time, you eliminate the slack required for Quality Assurance, mentorship of juniors, and—crucially—assisting sales with accurate scoping. You trade long-term EBITDA for short-term revenue, and you pay for it with a 30% attrition rate.
Generic utilization targets kill culture and margin simultaneously. You cannot hold a Senior Architect to the same standard as a Junior Developer. The 'Goldilocks Zone' for firm-wide utilization is 75-80%. Go higher, and you burn out your talent.
The New 2026 Benchmarks: Role-Based Targets
Stop managing to a flat number. A "75% target" is meaningless if it applies equally to a Year 1 Analyst and a Principal Architect. Operational excellence in 2026 requires a weighted portfolio approach to utilization. Based on data from top-performing firms (those achieving >20% EBITDA), here are the targets you must set:
1. The Delivery Engine (Juniors & Mid-Level): 80-90%
Your Analysts and Consultants are your production capacity. Their job is execution. They should be shielded from administrative drag and sales support. If your juniors are billing 65%, you have a demand generation problem or a staffing mismatch.
2. The Swing Vote (Senior Architects): 65-70%
This is where most Dynamics partners fail. They run their best technical minds at 90% utilization because their bill rates are high ($250-$350/hr). This is a trap. Your Seniors need 30% capacity to:
- Fix delivery issues before they become escalations.
- Mentor juniors (raising the junior's effective rate).
- Support Pre-Sales to ensure you aren't signing bad deals.
3. The Leadership (Partners & Directors): <40%
If you, the Founder, are billing 60% of your time, you aren't a CEO. You're a highly paid contractor. You cannot scale a $20M practice while debugging X++ code. Your time must shift to Revenue Architecture and strategic alliances.
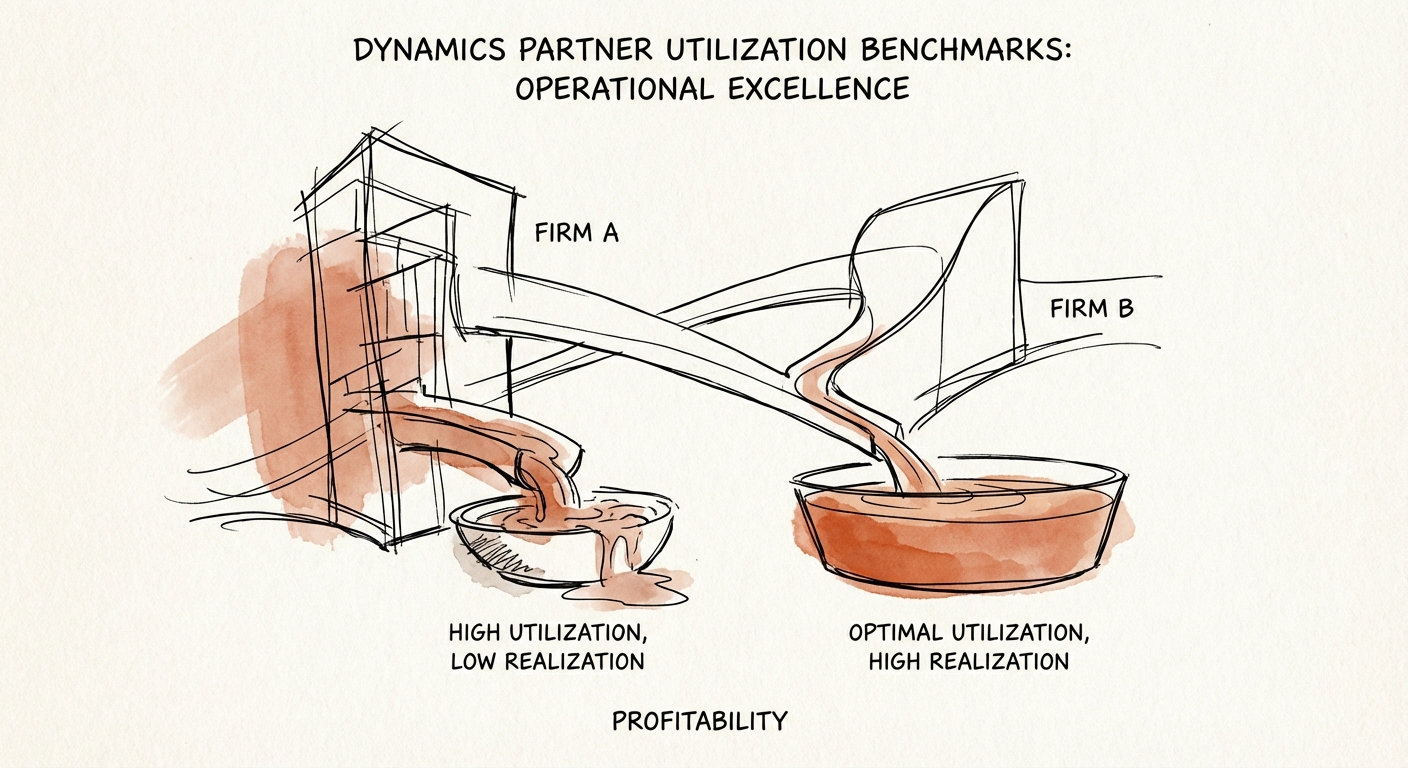
The Utilization/Realization Gap
The metric that matters more than Billable Utilization is Realized Rate. Many Dynamics partners run at 80% utilization but only realize 70% of their standard rate due to write-offs, rework, and scope creep. This is "False Productivity."
Consider two scenarios:
- Firm A: 85% Utilization, significant burnout, 15% write-offs due to rushed work. Effective Realization: 72%.
- Firm B: 75% Utilization, ample QA time, 2% write-offs. Effective Realization: 73.5%.
Firm B makes more profit, has happier clients (higher NRR), and retains staff longer. To achieve this, you need to implement a rigorous utilization tracking system that differentiates between "Billable" and "Productive" time.
The Operational Fix: Don't just raise targets. Fix your mix. Shift the heavy lifting to juniors (lower cost basis) and use your seniors to ensure that every hour billed is an hour paid. That is how you break the 9.8% EBITDA ceiling and move toward the 25% margins commanded by elite systems integrators.