The practical answer
- Short answer
- Salesforce partner EBITDA fell to 9.8% in 2025 as multi-cloud deals scaled risk faster than rates. The staffing-pyramid fix for $10M-$50M practices.
- Best fit
- Industry: Professional Services. Function: Operations
- Operating path
- Unit Economics → Commercial Performance → Transaction Advisory Services
- Key metric
- 68.9% Average Billable Utilization in 2025 (Down from 75% Target)
The deal that doubled your revenue and halved your year
Picture a 60-person Salesforce partner that spent 2023 doing Sales Cloud rollouts at a comfortable 48% gross margin. In 2025 they "leveled up": their average deal is now Sales + Service + Data Cloud + CPQ, and the contract value tripled. The founder told the board it was the best year in company history. The year-end P&L told a different story. Revenue up 31%. EBITDA down to single digits.
That gap is the whole game right now, and it isn't bad luck. According to Service Performance Insight's 2025 Professional Services Maturity Benchmark, average EBITDA across professional services organizations has fallen to 9.8% — a steep drop from the 15-20% that used to be table stakes. For Salesforce partners specifically, the collapse has a name: multi-cloud.
Here is the mechanism nobody scoped for. A single Sales Cloud build is a contained problem — one object model, one set of automations, one admin who can hold the whole thing in their head. The moment you add Data Cloud and CPQ, you are no longer doing one project. You are doing identity resolution, a real-time data harmonization layer, and a quote-to-cash engine that touches pricing, products, and approvals — each with its own failure modes, each integrating with the others. Complexity compounded. Your hours estimate didn't.
So the deal value tripled while the delivery risk went up roughly fourfold, and most partners under $50M still scope these statements of work the way they scoped Sales Cloud in 2022: line items, t-shirt sizes borrowed from Salesforce's own estimates, a 10% contingency. You charged 2x and absorbed 4x. That is not a growth story. That is, as the quote on this page puts it, financing your clients' transformations out of your own pocket — running a non-profit software installer with a logo wall.
A Data Cloud + CPQ deal isn't a bigger Sales Cloud deal. It's three integration projects wearing one statement of work. Scope it that way or it eats your year.
The tell: count how many architects are cleaning data
The instinct is to blame pricing. It's almost never pricing. The margin is leaking out of your staffing pyramid, and there is a one-question diagnostic that exposes it: on your current multi-cloud engagement, who is building the flows and reconciling the data? If the honest answer is "our Solution Architect, because they're the only one who understands Data Cloud," you are running a Hero Shop, and Hero Shops cannot scale past their best three people.
Watch what that does to the unit economics. A $200K+ architect doing senior-consultant work doesn't just cost you their loaded rate — it caps your entire model, because every new logo now requires hiring another unicorn who understands Data Cloud harmonization rules and CPQ price waterfalls. Those people are scarce and expensive. Peergenics' 2024-2025 Salesforce consulting cost data shows onshore technical architects commanding $250-$400/hr while offshore and nearshore delivery resources sit at roughly $40-$80/hr in cost. The spread between those two numbers is your business model. If you're not arbitraging it, you're structurally stuck.
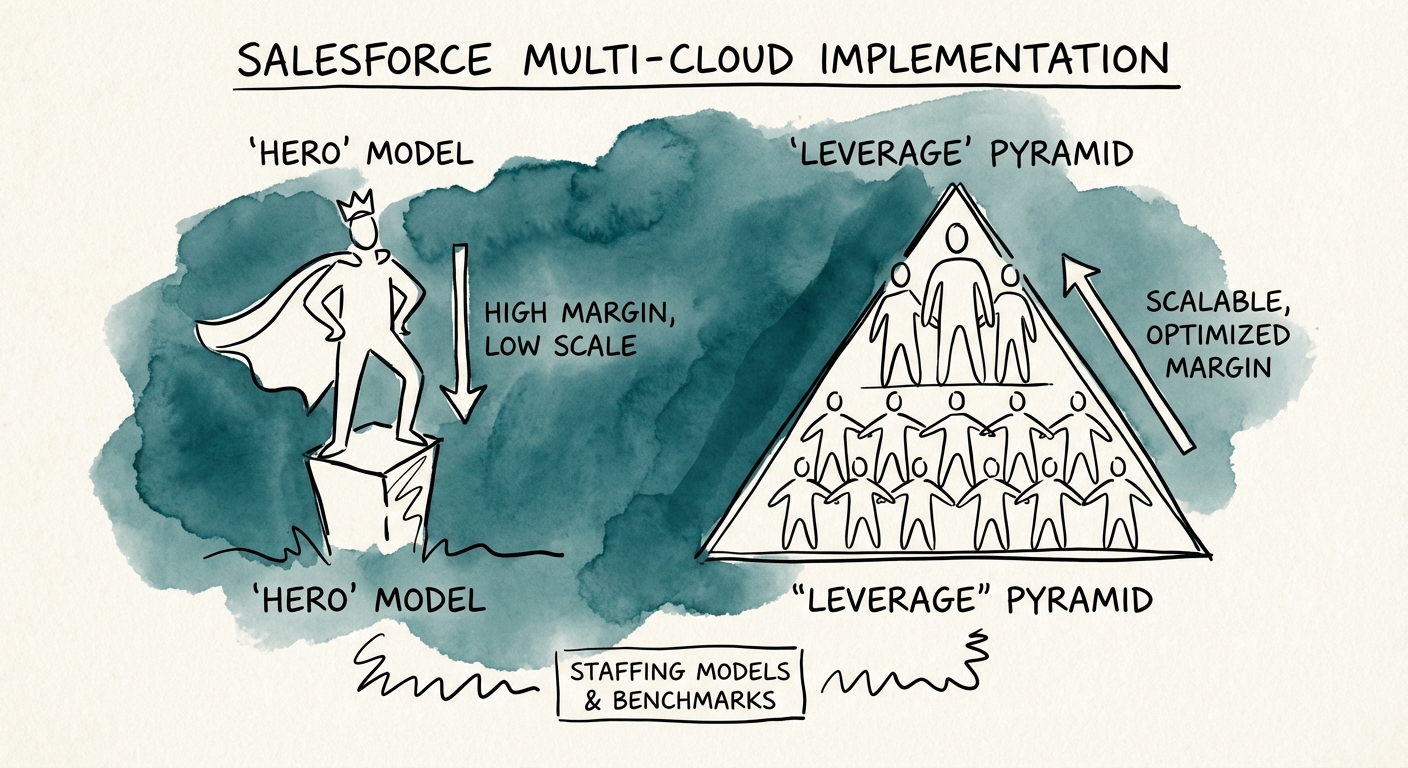
Two pyramids, two outcomes:
- The Hero pyramid (1 Architect : 2 Consultants). Your most expensive person is configuring objects and scrubbing migration data. Delivery cost devours the bill rate. Gross margin tops out around 35-40% and refuses to climb no matter how many deals you close.
- The Leverage pyramid (1 Architect : 4 Consultants : 2 Offshore/Nearshore Analysts). The architect designs the Data Cloud model and the CPQ logic — the genuinely hard, high-value calls — and bills heavy for a thin slice of hours. Consultants own the client and the cloud-specific configuration. Analysts execute QA, data migration, and routine build. Gross margin expands to 55-60%.
This is exactly the squeeze that's driving consolidation in the ecosystem. SalesforceBen and Tequity Advisors' 2025 Salesforce M&A Report tracks a partner market where boutiques that mastered the leverage pyramid are profitable acquisition targets and Hero Shops are not. You cannot beat the global SIs on price, and you cannot beat the disciplined boutiques on margin. Pick a pyramid.
Three moves you can make before next quarter closes
The fix is operational engineering, not a new rate card. The goal is to stop selling heroics and start selling a repeatable multi-cloud delivery system. Three concrete moves, in order of impact.
1. Run the utilization split, not the average. Billable utilization dropped to 68.9% industry-wide in 2025 — below 70% you are burning cash. But the blended number lies. Pull utilization by role this week. If your architects are pinned at 90% and your juniors are sitting at 50%, you do not have a pipeline problem, you have a delegation problem. The work is stuck at the top of the pyramid. Target 75% for delivery staff and force the routine build downward until the curve flattens.
2. Build a Data Cloud / CPQ scoping model from your own scar tissue. Stop custom-scoping every multi-cloud deal from a blank page, and stop trusting Salesforce's optimistic hour estimates. Take your last five multi-cloud projects, find the integration hours you actually burned, and bake a standing buffer into the baseline — for a CPQ + Sales Cloud build, start at a 20% integration buffer before you negotiate. When a client refuses to pay for the buffer, walk. The multi-cloud deals you lose at the right price protect you from the ones that would have wrecked the year.
3. Set a 20% offshore/nearshore floor — even if you're "high-touch." At least a fifth of billable hours (QA, data migration, baseline configuration) belongs on lower-cost resources. This isn't about being the cheap option; it's the only way to afford paying your onshore Data Cloud and CPQ specialists top of market. You cannot keep $250-$400/hr architects without $40-$80/hr analysts underneath them carrying the weight.
The partners getting acquired at strong multiples right now didn't get there on revenue growth. They got there because a buyer could see a delivery machine instead of a few irreplaceable people. If you want a clear-eyed read on which of your multi-cloud engagements are actually building enterprise value versus quietly subsidizing it, that's the conversation worth having before your next big deal lands.