The practical answer
- Short answer
- New 2025 SPI data reveals Workday partner utilization has dropped to 68.9%, crushing EBITDA to 9.8%. Here is the diagnostic playbook to fix your staffing mix.
- Best fit
- Industry: Professional Services. Function: Operations
- Operating path
- Unit Economics → Commercial Performance → Transaction Advisory Services
- Key metric
- 68.9% Average billable utilization in 2025 (SPI Research), dropping below the 75% efficiency threshold.
The 75% Utilization Hallucination
For the last decade, the "golden rule" of Workday partner economics was simple: hit 75% billable utilization, and you print 20% EBITDA. That math no longer works. According to the 2025 SPI Professional Services Maturity Benchmark (sponsored by Workday), average billable utilization across the sector has collapsed to 68.9%. Consequently, EBITDA margins have plummeted to 9.8%, the lowest in five years.
If you are a Workday partner CEO, you are likely feeling this visceral "profitless prosperity." Your top-line revenue might be growing (Workday subscription revenue is up 13%, and deal pipelines are up 8%), but your bottom line is evaporating. The culprit isn't just a "slow market"; it is a structural failure in how mid-market partners manage their most expensive asset: certified talent.
The "Shadow Bench" Problem
In the Workday ecosystem, the cost of a "bench" employee is significantly higher than in generalist IT services due to certification maintenance and the scarcity premium of talent. When utilization drops from 75% to 69%, you aren't just losing revenue; you are carrying a loaded cost base that was designed for a different era of efficiency.
We typically see the "Shadow Bench" hiding in three places:
- The "Ramping" Senior: You hired a Prism or Adaptive Planning expert on a guaranteed draw, but the pipeline for that specific SKU delayed by 90 days. They are 0% utilized but 100% cost.
- The Certification Holiday: Consultants pulled off billable work for mandatory recurrent training or new badge acquisition. In 2025, the complexity of the Workday SKU mix means this "non-billable maintenance" time has crept up from 5% to 8% of total capacity.
- The "Free" QA: Using expensive functional consultants to do basic QA or data validation because you haven't built a lower-cost offshore delivery center.
If your firm is doing $20M in revenue with 69% utilization, you are leaving approximately $3.2M of pure EBITDA on the table compared to a firm operating at best-in-class efficiency (78%+).
If you are doing $20M in revenue with 69% utilization, you are leaving approximately $3.2M of pure EBITDA on the table compared to a firm operating at best-in-class efficiency.
The Economics of "Bench Rot"
The most dangerous metric in a Workday practice isn't the utilization rate of your busiest consultant; it's the Revenue Per Consultant (RPC) across the entire pool. In 2025, this metric fell to $199,000 on average across the professional services sector. For a Workday partner, where average fully burdened labor costs (including certification fees) can exceed $140,000, an RPC of $199k is a death spiral.
You simply cannot survive on a 1.4x labor multiplier. To hit the industry-standard "Rule of 40" or even a healthy 20% EBITDA, an elite Workday practice needs to target an RPC of $260,000+.
The Certification Trap
Many founders fall into the "Certification Trap"—hiring and certifying ahead of the curve to meet Workday Partner Program tier requirements (Silver, Gold, Platinum). You hire for the badge, not the billable hour.
This creates a distinctive unit economics failure:
- Cost: You pay $5k-$10k+ for the certification plus the salary of a non-billable employee for 4-6 weeks.
- Lag: It takes 5.7 months for a new rep to ramp sales, meaning that certified consultant sits idle or under-utilized for two quarters.
- Attrition: If you don't utilize them, they leave. And unlike other ecosystems, they take the knowledge (and often the badge eligibility) with them, leaving you with the sunk cost.
Our data shows that firms with utilization below 70% experience attrition rates 15% higher than those in the "Goldilocks Zone" of 75-80%. Consultants want to work. When they sit on the bench, they get nervous, and they answer recruiter InMails.
The Fix: Utilization vs. Realization
Stop managing to a blended 75% utilization target. It is a blunt instrument that hides the bleeding. To restore your margins to 20%+, you need to shift to Role-Based Contribution Margins.
1. Bifurcate Your Utilization Targets
A Lead Functional Consultant on HCM should be utilized at 70-75%. They need bandwidth for high-value advisory and upsell identification. However, your Associate Consultants and Data Leads (the "doers") must be at 90%+. If your juniors are at 70%, you are overstaffed or under-sold. The blended average is lying to you.
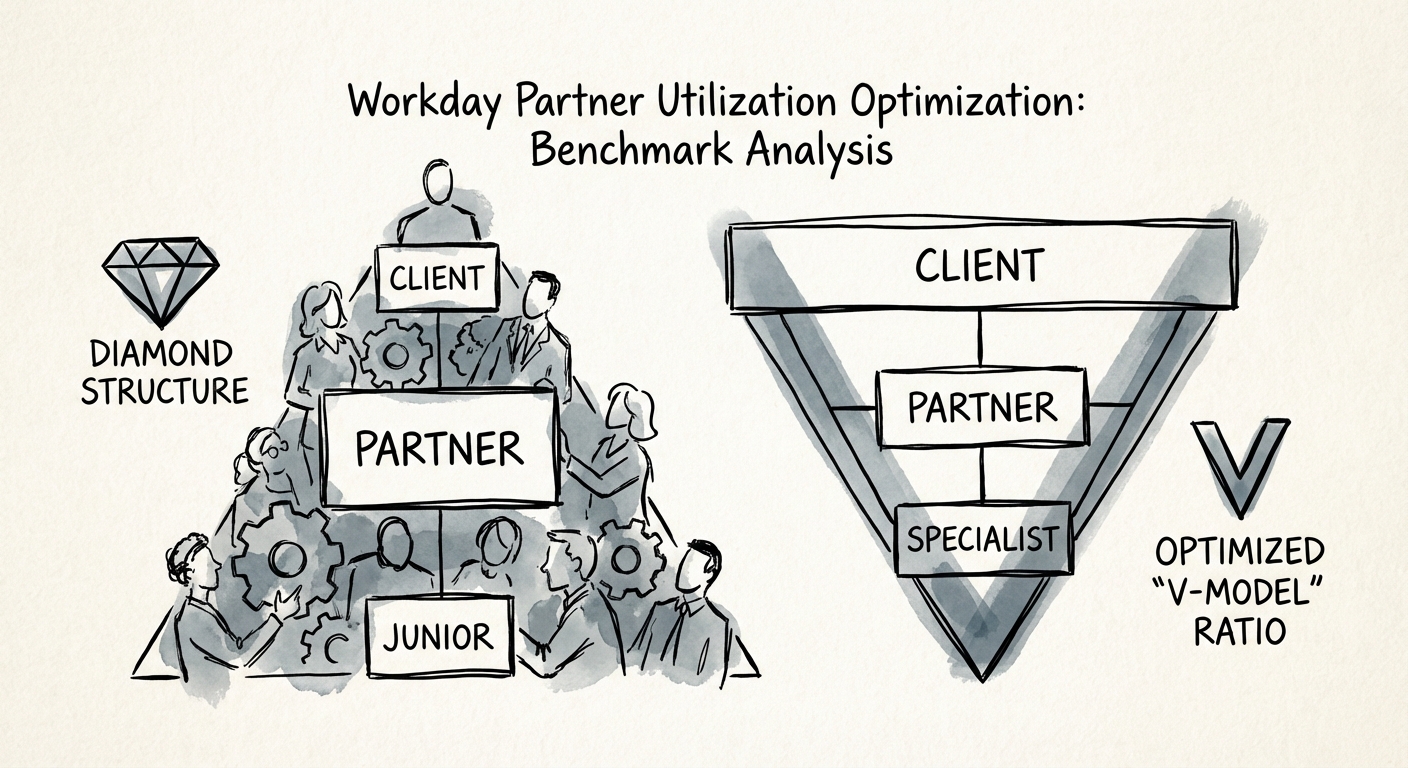
2. The "V-Model" Staffing Ratio
The most profitable Workday partners we audit operate on a 1:3:5 ratio:
- 1 Architect/Engagement Manager (Billable 50%)
- 3 Senior Consultants (Billable 75%)
- 5 Associates/Offshore (Billable 90%)
Many stalled firms operate as a "Diamond"—heavy on expensive mid-level seniors (the $160k cost basis) with few juniors. This structure makes 20% EBITDA mathematically impossible, even at full utilization.
3. Audit Your "Admin" Codes
Force a hard distinction between "Bench" (awaiting work) and "Investment" (building IP/Accelerators). If a consultant is on the bench, they must be building Workday Extend apps or reusable integration assets that have a direct path to monetization. "Self-study" is not a valid time code for a billable resource in a sub-10% margin environment.
You cannot cut your way to growth, but you can certainly inefficiency your way to bankruptcy. In 2026, the firms that win won't just be the ones with the most badges; they will be the ones that treat utilization as a financial discipline, not just a scheduling variable.