The practical answer
- Short answer
- New 2025 data shows average utilization has dropped to 68.9%, dragging EBITDA to 9.8%. Here is the calculator and playbook to fix it.
- Best fit
- Industry: Professional Services. Function: Operations
- Operating path
- Unit Economics → Commercial Performance → Transaction Advisory Services
- Key metric
- 68.9% Avg. 2025 Utilization Rate
The "Busy but Broke" Paradox
Walk into any professional services firm doing $10M to $50M in revenue, and you will see the same scene: Slack is buzzing, calendars are packed, and delivery teams are working late. By all visual evidence, the firm is at capacity.
Then you look at the P&L.
According to the 2025 Professional Services Maturity Benchmark by SPI Research, the average billable utilization rate has plummeted to 68.9%. This drop has dragged industry-average EBITDA margins down to a dangerous 9.8%—the lowest in five years. For a founder-led firm, this is the “Busy but Broke” paradox. Your people are exhausted, yet your bank account isn't reflecting their effort.
The problem isn't usually a lack of work. The problem is how you measure work. Most firms calculate utilization using “vanity math” that hides the leakage bleeding your margins. They measure hours logged against a theoretical 40-hour week, ignoring the reality of non-billable drift, scope creep, and administrative bloat. When you see a utilization report claiming 85%, but your EBITDA is stuck at 10%, you are looking at a lie.
In professional services, utilization is not just a productivity metric; it is the primary lever of your unit economics. A mere 5% increase in billable utilization can drive a 30% increase in EBITDA because your fixed costs (salaries) remain static while pure margin flows to the bottom line. If you want to fix your profitability, you must stop guessing at utilization and start calculating it with forensic accuracy.
A 5% increase in billable utilization can drive a 30% increase in EBITDA because your fixed costs remain static while pure margin flows to the bottom line.
The True Utilization Calculator
The standard formula (Billable Hours / 2,080) is obsolete. It assumes a robot-like 40-hour work week for 52 weeks a year, ignoring holidays, PTO, and human reality. To get a number that actually predicts profitability, you need to calculate Adjusted Capacity and measure Realized Utilization.
1. The Adjusted Capacity Formula
First, determine the true denominator. You are not paying for 2,080 hours of capacity. You are paying for:
- Gross Capacity: 52 weeks x 40 hours = 2,080 hours
- Less Holidays: 10 days x 8 hours = (80 hours)
- Less PTO/Sick: 15 days x 8 hours = (120 hours)
- Net Available Hours: 1,880 hours
If you use 2,080 as your denominator, you are artificially suppressing your utilization percentage. If you use 1,880, you get a clearer picture of efficiency relative to available time.
2. The Benchmarks: Role-Based Targets
A “flat” utilization target of 75% for everyone is a recipe for failure. Senior leaders need time for business development; juniors should be delivery machines. New 2025 benchmarks clarify the targets required to hit 20%+ EBITDA:
- Junior Consultants / Analysts: 85% - 90% (Delivery focus)
- Mid-Level Consultants: 75% - 80% (Delivery + Mentorship)
- Senior Architects / Principals: 50% - 65% (QA + Pre-Sales Scoping)
- Partners: <20% (Strategy + Sales)
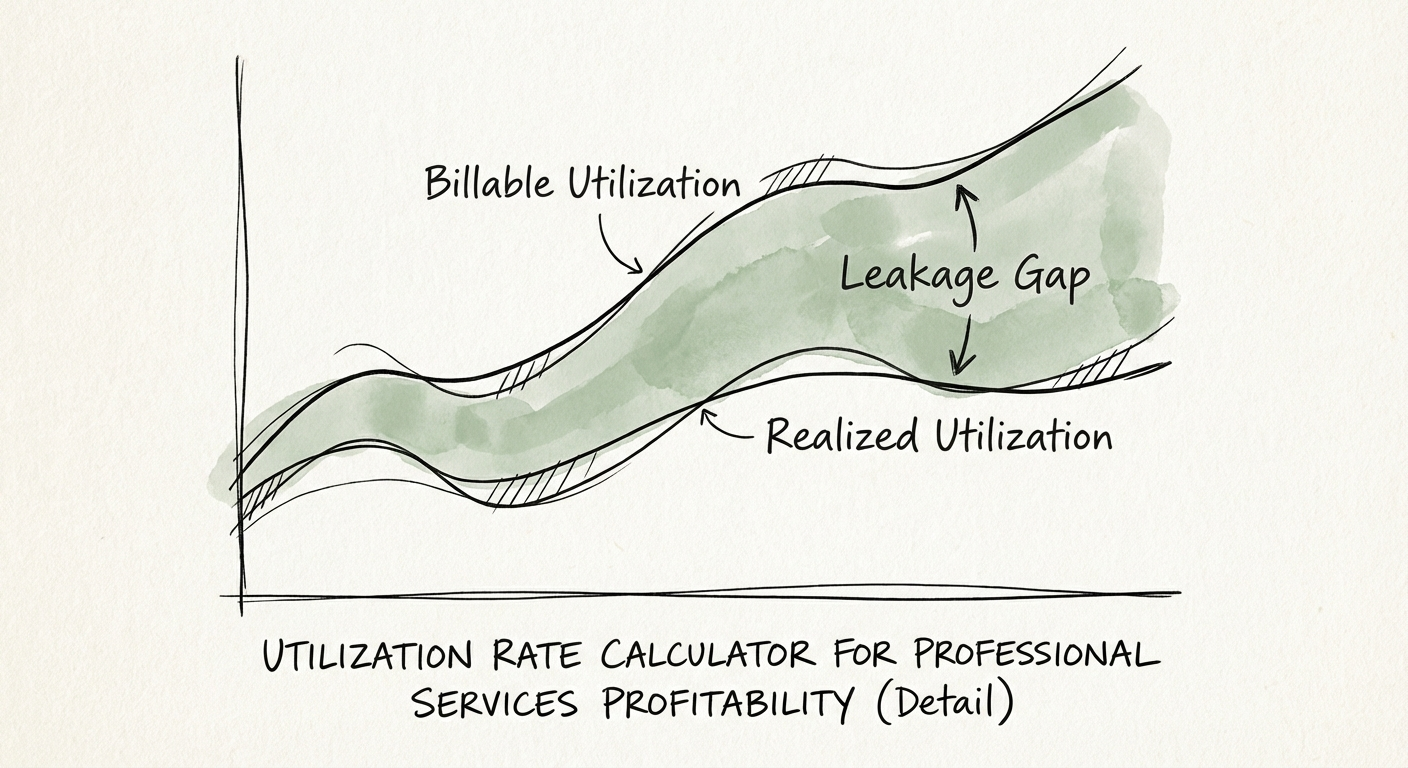
3. Billable vs. Realized: The “Leakage” Gap
This is where EBITDA dies. Billable Utilization is what your team puts in their timesheets. Realized Utilization is what you actually invoice the client. The gap between them is caused by write-downs, caps on T&M projects, and scope creep on Fixed Fee work.
Formula: (Total Billed Revenue / Hourly Rate) / Total Available Hours
If your Billable Utilization is 80% but your Realized Utilization is 65%, your team isn't the problem—your scoping and revenue leakage are. You are doing work you cannot charge for.
The 90-Day Utilization Rescue Plan
You cannot simply demand people “work harder” to fix a 68.9% utilization rate. You must structurally remove the friction that prevents billing. Here is the operator’s playbook for reclaiming your margins.
1. Audit the “Inactive” Projects
Identify the internal codes where time goes to die. “Admin,” “General,” and “Business Development” (for non-sales staff) are often dumping grounds for unallocated time. Kill internal meetings that do not directly drive revenue or retention. If a meeting costs $2,000 in billable capacity, it better generate $10,000 in value.
2. Shift from “Heroics” to “Systems”
High utilization often drops because senior staff are stuck fixing delivery issues instead of billing. This is a symptom of tribal knowledge. Document your delivery processes so junior staff can execute 80% of the work. This allows your high-rate seniors to focus on high-value, billable oversight rather than non-billable firefighting.
3. Enforce the “40-Hour Floor”
Make timesheet compliance about forecasting, not policing. If timesheets aren't done by Friday at 5 PM, you cannot forecast revenue for next week. Implement a “40-Hour Floor” policy: every delivery employee must account for 40 hours of time, whether billable or not. This forces the “shadow work” into the light, allowing you to identify exactly where capacity is leaking.
The Bottom Line: 68.9% is not a “market trend” you have to accept. It is a signal that your operational rig is loose. Tighten the bolts on your utilization logic, and you will see the impact in your EBITDA within 30 days.