
The practical answer
- Short answer
- Azure resale margins now run 8-15%, utilization slid to 68.9%, and PE strips your consumption revenue in QofE. The 2026 unit-economics playbook for Azure partners.
- Best fit
- Industry: B2B Tech Services / MSP. Function: Operations & Finance
- Operating path
- Unit Economics → Commercial Performance → Transaction Advisory Services
- Key metric
- 68.9% Average billable utilization rate for professional services firms in 2025—a 'danger zone' for profitability.
The invoice that grew 40% and the paycheck that didn't
Picture a 60-person Azure partner, call it a hypothetical Pacific Northwest shop, that just closed its best year ever: $18M in revenue, up 40%. The founder walks into the budget review expecting to talk about a hiring plan and a bigger office. Instead the CFO slides over a single line: EBITDA is flat. Same dollars of profit on six million more dollars of revenue.
That gap is not a mystery. It is the predictable result of letting Azure Consumed Revenue become your scoreboard. For most of the last decade, Microsoft trained the entire partner channel to chase ACR, your partner development manager celebrated it, and your previous valuation conversation probably leaned on it. The problem is that consumption you resell is not profit you keep.
The resale margin most founders still misquote
The 20-point CSP margins partners reminisce about are gone. In 2026 a typical Azure CSP resale spread lands somewhere between 8 and 15 points, and the top of that range only exists if you clear every gate in the Microsoft Commerce Incentives program. Miss a Solution Partner designation in the relevant workload, let a Partner Admin Link lapse, fall short on a measured-net-customer-add target, and the incentive that was carrying your margin quietly stops paying. You can be selling more Azure every quarter and earning a thinner cut on each dollar.
The trap is that this revenue is expensive to service. You staff a Cloud Architect at $180K or more to babysit subscriptions whose resale layer throws off less gross profit than the hours you bill against them. You are not building a business there. You are running a billing department for someone else's cloud and paying senior-engineer wages to do it.
Why a $20M shop can be worth less than a $10M one
Blend 8-point resale revenue into 40-point services revenue and your reported gross margin becomes a number nobody can act on. It looks fine until a buyer takes it apart. In a Quality of Earnings review, the resale line gets pulled out and re-rated almost to zero, because the diligence team treats pass-through consumption as administered billing, not earned value. That is why a $20M partner with $10M of Azure resale can clear diligence at a lower multiple than a clean $10M services firm. Microsoft reports tens of billions in quarterly cloud revenue (see Microsoft's FY25 Q2 earnings release); the channel's job in that machine is to move it, and movers do not get paid like owners.
A dollar of Azure resale revenue and a dollar of managed-platform revenue look identical on your top line and nothing alike in a data room. The buyer knows the difference. The question is whether you do before you sit across from them.
68.9% is not "a little below target." For an Azure team it's a leak.
If resale is the structural problem, delivery utilization is the operational one, and the benchmark moved against you. The historical comfort zone for professional-services utilization sat around 75-80%. The 2025 Professional Services Maturity Benchmark from SPI Research puts the industry average billable rate at 68.9%. Six lost points of capacity on a team of fifty architects is a full-time crew of three people you are paying and not billing.
What makes Azure practices bleed faster than a generic dev shop is that three specific costs hide inside that number, and none of them show up where you'd look.
The certification treadmill never stops moving
The Azure surface area expands faster than your team can invoice. Between Azure OpenAI, Copilot, Fabric, and whatever lands at the next Ignite, your senior people spend real weeks each year just staying current enough to be credible in a sales call. Try to run them at 85% billable and one of two things happens inside six months: they burn out, or their skills go stale and you lose the deals that required the new badge. The certification load is a cost of being an Azure partner. Bake it into your bill rates or it eats your margin invisibly.
The free assessment that lives in the wrong column
To win the migration, you give away the front of it. Someone runs Azure Migrate, builds the TCO model, and walks the CIO through the findings, often forty hours of your most expensive architect's time with no SOW attached. The accounting choice matters more than the hours: when that pre-sales engineering sits in COGS instead of sales and marketing, it drags down the delivery margin a buyer will scrutinize line by line. You did the work to win business and booked it as if you were delivering business.
The generalist's idle minutes
The architect who claims to do AVD and AKS and Data Factory and firewall work is a utilization sink, not a hero. When a Data Factory pipeline is mid-deploy, that engineer cannot pivot to a networking ticket and pick up where someone else left off; the context simply doesn't transfer cleanly across those Azure domains. Those stranded minutes compound into whole billable days lost every month. Pods organized around a workload hold a higher line than generalists chasing whatever ticket is loudest.
The lever that turns an 8-point deal into a 45-point one
The fix is not "sell more services." It is changing what you are to the customer's Azure tenant. The firms that win the multiple, including the fewer than 150 Azure Expert MSPs worldwide, share one trait: they hold operational control of the environments they earn from. Control is what unlocks the economics.
Find your rung, then climb one
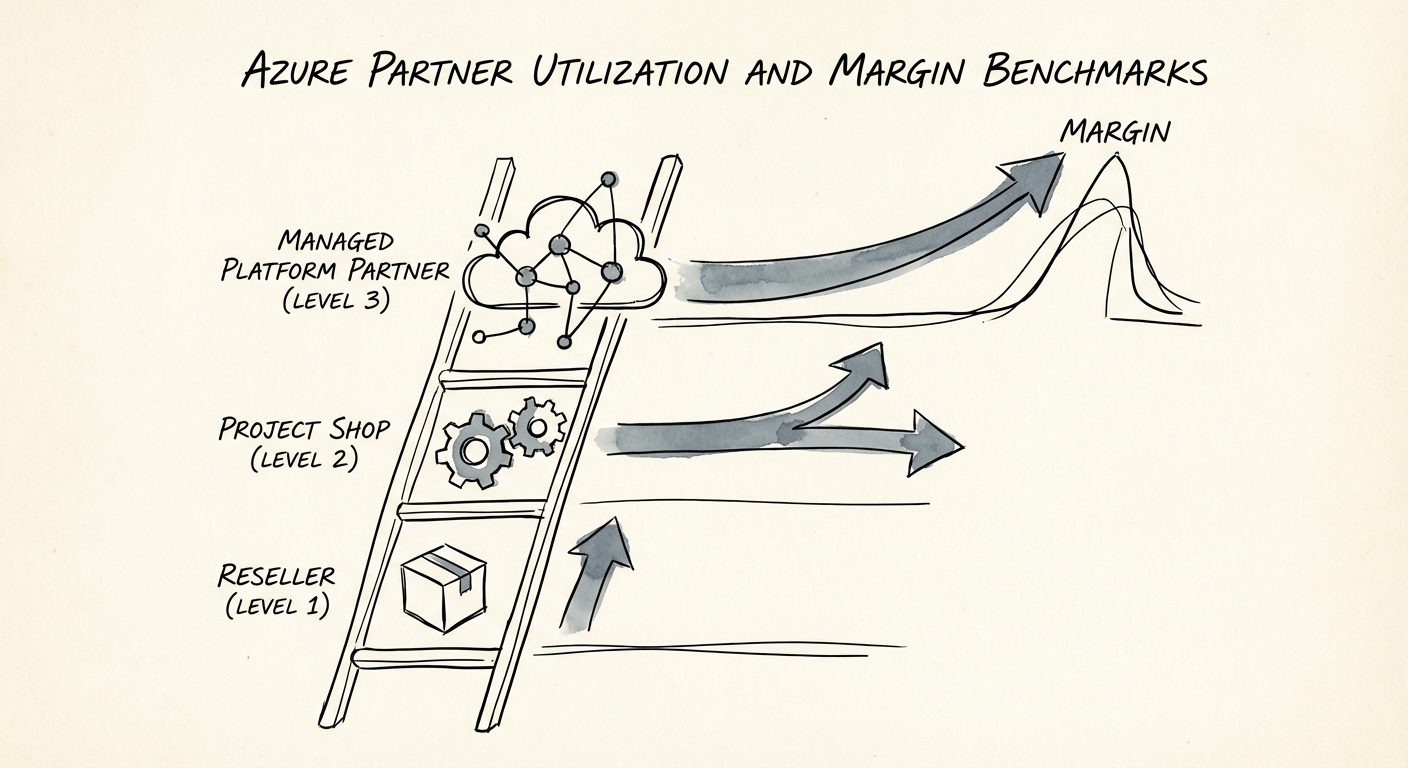
Lay your P&L against three honest operating models and locate yourself before you argue about strategy:
- The reseller. Revenue is mostly CSP consumption. Gross margin 8-12 points. In a sale, this revenue gets discounted toward zero, so the business trades near a turn of revenue, not a multiple of earnings.
- The project shop. Revenue is migrations and app modernization. Gross margin 35-40 points, utilization hovering near that 68.9% average, EBITDA multiples in the mid-to-high single digits. Real, but lumpy, and only as good as the next signed SOW.
- The managed platform partner. Revenue is recurring managed Azure plus your own IP. Gross margin past 50 points, multiples in the low double digits, because the earnings are durable and the customer can't easily leave.
The distance between rung one and rung three is not talent. It's the operating model you'll be measured on in a data room.
Partner Earned Credit is the mechanism, not a footnote
The concrete bridge is Partner Earned Credit. Microsoft hands managed-services partners a credit, often worth roughly 15 points of margin, on condition that you hold genuine 24/7 operational responsibility for the customer's environment, demonstrated through Azure Lighthouse or admin-on-behalf-of access. No control, no credit. It is designed to reward the partner doing the actual operating, not the one who simply placed the order.
Stack the moves and the picture changes fast. Convert a resale customer into a managed one. You now patch, secure, monitor, and right-size their tenant, which justifies a managed-service fee, commonly 20-30% of consumption, charged on top of the PEC margin. The same account that was throwing off 8 points as pass-through can clear into the 40s as a managed contract, and the revenue turns recurring, which is the part the buyer pays for.
So the Monday action is unglamorous and exact: open your top ten accounts by Azure spend, mark which ones you actually control via Lighthouse or AOBO, and treat every uncontrolled account as an unconverted PEC opportunity rather than a happy customer. The conversion list is your margin-expansion plan, and unlike a new logo, it requires no net-new sales motion to start.