
The practical answer
- Short answer
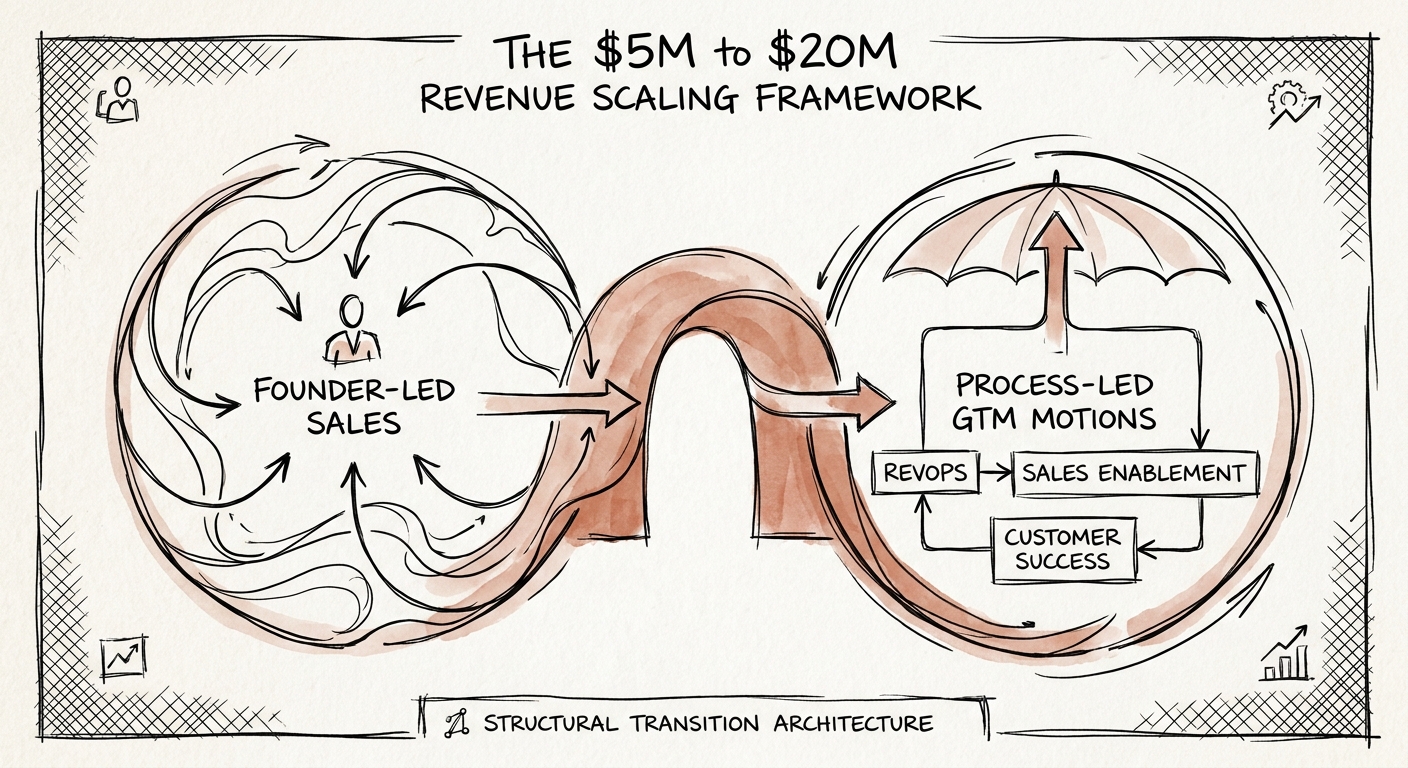
- The systems that got you to $5M ARR break at $10M. Here's the revenue architecture that has to exist before you hire the next rep — not after.
- Best fit
- Industry: B2B Technology / SaaS. Function: Revenue Operations
- Operating path
- Revenue Architecture → Commercial Performance → Office of the CFO
- Key metric
- 3 Revenue architecture foundations to validate before scaling headcount: customer fit, qualification, and RevOps instrumentation.
The founder is the product demo, the reference, and the discount approver
Watch what actually happens when a $5M ARR founder takes a sales call. A prospect pushes back on price; the founder reshapes the deal on the spot. Someone asks about a roadmap gap; the founder commits to building it. A reference is requested; the founder dials a friend who runs ops at a marquee logo. The deal closes in three weeks. Then you hire your first non-founder account executive, hand them the same target list, and watch them close at half the rate over twice the cycle. Nothing about the product changed. The thing that changed is that the closer no longer has the title that lets them bend the company to fit the buyer.
That gap is the whole problem in the $5M to $20M climb, and it is why "add more reps" is the most expensive mistake at this stage. Pitchbook's 2026 B2B SaaS Scaling Report found that venture-backed companies which build go-to-market infrastructure before adding raw headcount hit their next revenue milestone faster — because new reps inherit a process instead of reverse-engineering the founder's instincts. The burn from skipping this isn't just the salaries of underperforming AEs. It's the quota they miss, the qualified pipeline they mishandle, the wrong-fit logos they sign that churn 14 months later, and the founder time consumed cleaning it all up. In one engagement with a mid-market SaaS provider, leadership was certain they had a top-of-funnel volume problem and was about to fund three new SDRs. We mapped the actual buyer journey stage by stage and the leak was nowhere near the top — deals were stacking up and dying between "technical validation" and "procurement" because no one had built the ROI model the founder used to deliver verbally. Fixing the mid-funnel handoff recovered more stalled pipeline than three SDRs ever would have generated.
At $5M the CEO's title is closing the deals. The day you stop being in the room, you find out whether you have a sales process or just a charismatic one.
The $10M crossing is a different buyer, not just a bigger number
Between roughly $8M and $12M ARR, a specific thing breaks, and it breaks in a way the dashboards don't warn you about. Your early adopters — the people who bought because the category was new and exciting — are tapped out. The next cohort is the pragmatic, risk-averse enterprise buyer who wants security reviews, three live references in their exact vertical, a procurement process, and proof you'll still exist in three years. That buyer costs dramatically more to acquire and pays you back far more slowly. Gartner's 2025 B2B SaaS Growth Benchmarks put the average CAC payback period at 18.5 months once you cross $10M. Read that number against your cash position, not your growth chart. If your gross margin and pricing can't absorb an 18-month payback window, every "good" quarter is quietly digging the hole deeper — you are growing into a cash crisis, and you'll feel it two quarters after the damage is done.
This is also the worst possible moment to mis-hire your first VP of Sales, and most companies do exactly that here — they hire a logo from a $200M company who has never built a motion, only inherited one. The cost isn't just severance. It's the three-plus quarters of growth you lose while pipeline momentum stalls and the team relearns what they unlearned. The defense is unglamorous: real qualification discipline before you scale spend. Bain & Company's 2025 B2B GTM Efficiency Report found 55% of Series B capital gets burned on go-to-market motions chasing the wrong buyer. The fix is a hard-edged definition of which accounts actually convert and stay — and the discipline to walk away from revenue that doesn't fit it. Pull your last 40 closed deals, sort by net revenue retention 12 months in, and find the shared traits of the top decile. That's your real target. Everything else is the revenue that walks through the door and walks back out. Building that ideal-customer profile rigorously, the way a disciplined customer acquisition framework demands, is what protects your multiple, because acquirers price NRR, not gross bookings.
Build the nervous system before you build the org chart
The companies that clear $20M cleanly all make the same unsexy move: they stand up Revenue Operations as a real function with authority, not a Salesforce admin who reports to whoever yells loudest. RevOps is the nervous system here — the single source of truth for pipeline, win rate, and customer health. Without it your forecast is a story your reps tell you, and you find out it was fiction on the last day of the quarter. McKinsey's 2026 Go-to-Market Architecture Study found that an empowered RevOps function lifts enterprise win rates by 22% across exactly this $5M-to-$20M band. Concretely, that means instrumenting leading indicators — demo-to-close velocity, pipeline coverage ratio, stage conversion — so you can see a quarter break while you can still fix it, not after the board call. It also means your CRM, marketing automation, and customer success tools stop being three disconnected databases that disagree with each other about what's true.
Systemizing the commercial process does something the spreadsheet can't show you directly: it kills volatility. Federal Reserve Economic Data's 2026 SME Growth Volatility Index shows businesses that standardize their sales and operating processes cut quarterly revenue variance by 30% — and predictability is what turns a risky growth story into a financeable, acquirable one. A documented playbook lets you onboard a rep in weeks instead of months, flag an underperformer inside their first 90 days instead of their third quarter, and — the point of the entire exercise — decouple revenue from the founder's calendar. So make it concrete this month: map your deal stages and define the exit criteria for each one, pull the NRR-by-cohort analysis to find your real ideal-customer profile, and name one person who owns the number end to end. Sequence those against a 24-month operational milestone map so the build order matches your capital runway. Scaling to $20M isn't a test of how hard you can sell. It's a test of whether the engine runs when you leave the room.