The practical answer
- Short answer
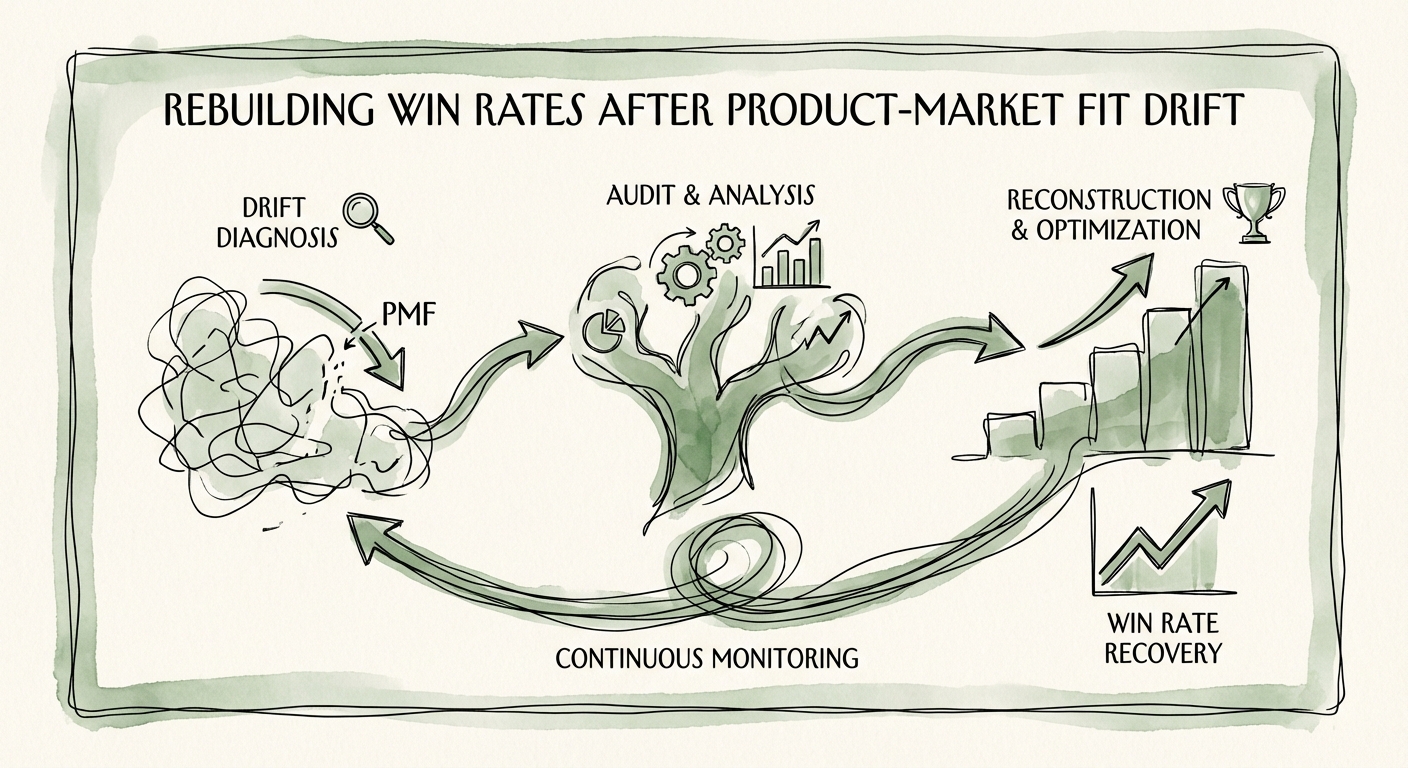
- Declining win rates often signal Product-Market Fit (PMF) Drift, not sales failure. Learn the diagnostic playbook to realign GTM strategy and recover lost deal value.
- Best fit
- Industry: B2B Technology. Function: Revenue Operations
- Operating path
- Revenue Architecture → Commercial Performance → Office of the CFO
- Key metric
- 21% The median B2B win rate in 2025, with enterprise deals often dipping to 12-18% due to increased complexity.
The Silent Killer of Valuation: Diagnosing PMF Drift
In the high-pressure environment of private equity-backed technology, a declining win rate is almost always misdiagnosed. The Board looks at the numbers—dropping from a healthy 30% to a mediocre 21%—and immediately points fingers at sales execution. They fire the VP of Sales, hire a ‘closer’ mentality leader, and increase quotas to compensate for the gap. Six months later, the win rate hasn’t budged, but morale has collapsed.
This is the classic symptom of Product-Market Fit (PMF) Drift. Unlike the startup phase where you are searching for fit, PMF Drift occurs in mature companies when the market evolves away from a static value proposition. Your product hasn’t changed, but your competitors, buyer priorities, and economic context have. The result is a gradual erosion of win rates that training and spiffs cannot fix.
Recent 2025 benchmarks indicate that while top-performing B2B organizations maintain win rates above 35%, the median has slipped to roughly 21%, with enterprise deals often falling into the 12-18% range due to increased scrutiny and ‘feature parity’ perception. When a portfolio company drifts into this ‘danger zone,’ it isn’t losing deals because reps can’t sell; it is losing because the market no longer views the solution as a ‘must-have’ at the current price point.
Win rate is the ultimate truth-teller. If it drops below 20%, you don't have a sales problem. You have a strategy problem. You are selling yesterday's innovation to today's skeptic.
The Forensic Audit: Moving Beyond "Price" in Win/Loss Analysis
To confirm Drift, you must stop accepting "Price" as a loss reason. In 90% of cases, "Price" is simply a proxy for value misalignment. If a prospect understood the ROI, they would pay. When they cite price, they are really saying, "Your product is a commodity, and I can get this utility cheaper elsewhere."
A forensic GTM audit looks for three specific signals of Drift:
- The Feature Parity Trap: When prospects view your "differentiators" as standard table stakes. If your "AI" or "Automation" features are now matched by cheaper competitors, your premium pricing is no longer defensible.
- The Implementation Trust Gap: 2025 data suggests that "Implementation Risk" is now a top-3 loss reason. Buyers are terrified of shelfware. If your sales process doesn't explicitly de-risk the first 90 days, you lose to the incumbent or 'no decision.'
- The Champion Vacuum: You are getting meetings but not second meetings. This indicates your message resonates high-level (Marketing Fit) but fails to survive technical or financial scrutiny (Product Fit).
Portfolio leaders must demand a rigorous analysis of the last 20 losses. If the themes point to product capabilities or market relevance rather than rep behavior, you have a Drift problem, not a Sales problem.
The Reconstruction: A 90-Day Realignment Sprint
Recovering from Drift requires a "operating reset" of your Go-To-Market strategy. You cannot simply "sell harder" against a market current that has turned against you. The recovery playbook focuses on narrowing the aperture to widen the win rate.
1. Disciplined Segmentation (The "Kill Your Darlings" Phase)
Stop selling to everyone. Analyze your customer base to find the 20% of segments where win rates remain >30%. These are your "Safe Harbors." For the next 90 days, the sales team is only allowed to hunt in these segments. We often see firms shrink their TAM to grow their revenue. By focusing resources on the segments where PMF still exists, you artificially inflate the win rate and rebuild momentum.
2. The "Re-Onboarding" of the Sales Team
Your reps are likely pitching a 2023 version of the value proposition. The Reconstruction involves a mandatory recertification on a new, data-backed narrative that directly addresses the current market anxieties (e.g., consolidation, efficiency, AI pragmatism). This isn't just a new deck; it's a new logic for why you exist.
3. Pricing for Adoption, Not Just Yield
If Drift has commoditized your core offering, consider shifting pricing models to capture value elsewhere. We see success in moving from per-seat licensing (which is scrutinized) to consumption-based or outcome-based models that align cost with realized value. This lowers the barrier to entry and allows you to expand after value is proven, circumventing the initial friction.