
The practical answer
- Short answer
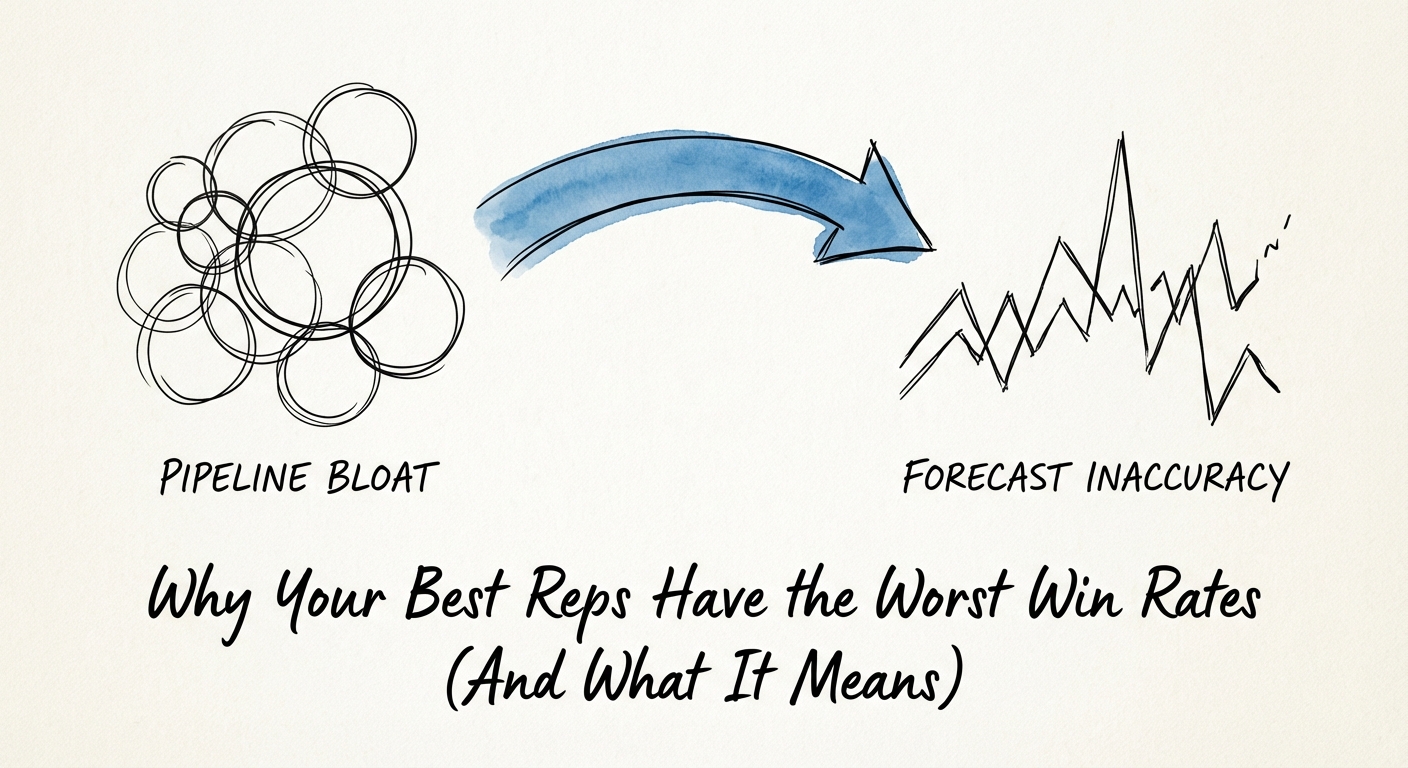
- Why your highest-revenue sales reps might have the worst win rates, and how this 'brute force' strategy destroys unit economics and CAC efficiency.
- Best fit
- Industry: B2B Technology. Function: Sales
- Operating path
- Revenue Architecture → Commercial Performance → Office of the CFO
- Key metric
- 36% Percentage of forecasted deals that slip past projected close dates due to pipeline bloat.
The 'Volume Hero' Illusion
In every quarterly board meeting, there is one slide that gets a nod of approval: the "Top Performers" leaderboard. At the top sits the "Rainmaker"—the rep who consistently hits 120% of quota. They are the golden child. They get the first pick of inbound leads, the largest territories, and the most leniency on CRM hygiene. But if you peel back the layers of their performance, you often find a unit economics disaster hiding in plain sight.
We call this the Volume Hero paradox. While this rep brings in the most gross revenue, they often do so through brute force rather than skill. They hoard territories, demand 4x the lead volume of their peers, and operate with a win rate that hovers around 15%—significantly lower than the industry median of 21-29% for B2B SaaS. In contrast, your true "Elite" performers (often sitting quietly at #2 or #3 on the leaderboard) achieve 100% of quota with a 35% win rate, consuming half the marketing resources to generate the same output.
For a Private Equity sponsor, the Volume Hero is a liability disguised as an asset. They inflate your Customer Acquisition Cost (CAC) by churning through expensive marketing leads, and they starve the rest of the sales floor by sitting on accounts they will never close. They aren't hunting; they are strip-mining your Total Addressable Market (TAM).
Your top revenue producer might be your most inefficient employee. If they need 500 leads to close 10 deals while others need 100 to close 5, they aren't a rainmaker—they're a resource drain.
The Cost of 'Inactive' Pipelines
The primary mechanism of the Volume Hero is pipeline hoarding. To maintain the illusion of inevitably hitting their number, they stuff their pipeline with low-quality opportunities. Recent data indicates that 36% of forecasted deals slip past their projected close dates, often because reps are incentivized to show "activity" rather than "accuracy."
These are "Inactive Deals"—opportunities that sit in Stage 2 or 3 for 90+ days, neither dying nor closing. The Volume Hero keeps them alive to justify their large territory or to mask a lack of new prospecting. The impact on your sales forecast accuracy is devastating. When you have a rep with $2M in pipeline to close $400k, you aren't seeing 5x coverage; you are seeing 80% waste.
This behavior creates a "phantom revenue" problem during due diligence or exit planning. A potential acquirer will look at your pipeline-to-bookings ratio and apply a massive haircut to your valuation, recognizing that your "3x pipeline coverage" is actually composed of stale deals hoarded by inefficient reps. Furthermore, this hoarding prevents younger, hungrier reps from working those accounts, effectively capping your organization's organic growth rate.
The Diagnostic: Efficiency Over Volume
To fix this, you must change how you evaluate "best." Stop ranking reps solely by total bookings. Start ranking them by Revenue Per Lead and Win Rate Per Stage. True elite performers are disciplined disqualifiers; studies show they close nearly 30% of opportunities as "lost" during the discovery phase, protecting their time for winnable deals.
The Fix:
- Cap Active Opportunities: Limit reps to 30-40 active opportunities at a time. If they want to add a new prospect, they must kill a inactive deal. This forces prioritization.
- Implement 'Rotting' Rules: Automate the movement of deals to 'Closed-Lost' if they haven't progressed in 45 days. If the rep wants it back, they have to re-qualify it.
- Audit Lead Consumption: Measure how many marketing qualified leads (MQLs) each rep consumes to close $1 of revenue. You will likely find your Volume Hero is your most expensive channel.
By shifting the focus to efficiency, you expose the phantom revenue in your pipeline and build a sales engine that scales on process, not just personality.