
The practical answer
- Short answer
- High AWS costs aren't just OpEx—they're a sign of deep technical debt. Here's how to audit cloud architecture during due diligence to protect EBITDA.
- Best fit
- Industry: Private Equity / B2B SaaS. Function: Technology / Engineering
- Operating path
- Technical Debt → Turnaround & Restructuring → Transaction Advisory Services
- Key metric
- 32% Of cloud spend is wasted annually due to overprovisioning and idle resources (Flexera 2025).
The $5M EBITDA Leak Hidden in the AWS Bill
You are looking at a target's P&L. The revenue growth looks decent, but the Gross Margins are dragging. You ask the CTO about the massive AWS line item, and you get the standard answer: "We're scaling rapidly, and cloud infrastructure is the cost of doing business."
Do not accept that answer.
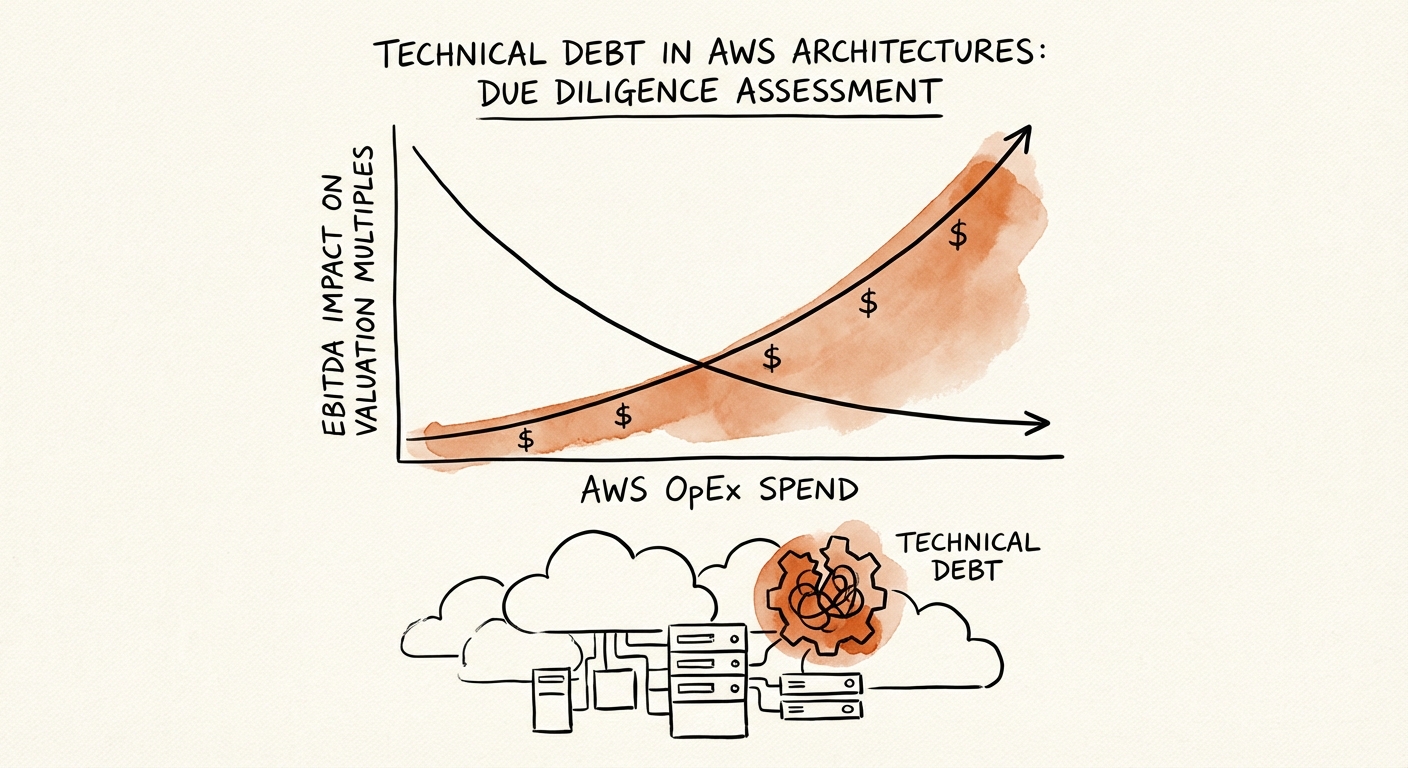
In 2026, AWS spend is not just an operating expense; it is a proxy for architectural technical debt. High cloud costs rarely mean a company is growing too fast to optimize. They usually mean the engineering team performed a "lift and shift" migration three years ago—taking their bloated, on-premise virtual machines and dumping them directly onto expensive EC2 instances—and never went back to fix it.
According to the 2025 Flexera State of the Cloud Report, 32% of all cloud spend is wasted. For a company spending $2M annually on AWS, that is $640k in pure waste. But the valuation impact is far worse. That $640k is OpEx. It reduces EBITDA dollar-for-dollar. At a 10x multiple, that inefficient architecture is costing you $6.4M in Enterprise Value.
When we conduct technical due diligence, we don't just look at the code quality. We look at the AWS bill. It tells us more about the engineering culture than the GitHub repository does. A bloated bill indicates a team that prioritizes speed over sustainability and lacks the discipline to refactor. It is a sign of "lazy scaling"—throwing hardware at software inefficiencies.
If 80% of the compute bill is for EC2 and zero is for Lambda, you aren't buying a cloud company. You're buying a legacy data center hosted on Jeff Bezos's computers.
The 5 Warning Signs of 'Lift and Shift' Debt
How do you spot this during a two-week diligence window without access to the root console? You ask for the AWS Cost Explorer export (grouped by Service and Usage Type) and look for these specific red flags.
1. The EC2 vs. Lambda Ratio
If 80%+ of the compute bill is for Amazon EC2 (Elastic Compute Cloud) and near zero is for Lambda or Fargate, you are buying a legacy data center hosted on Jeff Bezos's computers. Modern, cloud-native architectures use serverless (Lambda) or containerized (EKS/Fargate) resources that spin down when not in use. Persistent EC2 instances running 24/7 are the hallmark of a "lift and shift" operation.
2. The 'On-Demand' Addiction
Check the coverage of Reserved Instances (RIs) or Savings Plans. A mature SaaS company should have 70-80% of its predictable compute covered by these 1-3 year commitments, which offer 30-72% discounts. If the target is running 90% "On-Demand," they are essentially paying hotel rack rates for a long-term lease. This is low-hanging fruit for you post-close, but it's also a sign of poor financial governance.
3. The EBS 'Inactive' Volumes
Look at the storage costs. Specifically, look for Unattached EBS Volumes and Old Snapshots. In "lift and shift" environments, developers often spin up instances for testing, terminate the instance, but forget to delete the attached storage volume. These "inactive" volumes persist, costing money every month for data that no one is using.
4. The Data Transfer Trap
High Data Transfer Out (Egress) costs often indicate poor architectural design. It means the application is chatting inefficiently across regions or availability zones, or serving heavy static assets directly from web servers instead of through a Content Delivery Network (CDN) like CloudFront. This is architectural friction that slows down the user experience while bleeding margin.
5. The Kubernetes Overprovisioning
If they claim to be modern because they use Kubernetes, check the utilization. According to Komodor's 2025 Enterprise Kubernetes Report, 82% of Kubernetes workloads are overprovisioned, with most using less than half their requested CPU. Engineers often request "double capacity" to be safe, creating massive invisible waste.
Converting Technical Debt into Margin Expansion
The good news is that AWS technical debt is one of the few types of debt that pays you to fix it. Unlike refactoring a monolithic code base (which can take years), cloud remediation often yields results in 90 days.
The Remediation Playbook
Do not let the target company convince you that fixing this requires a "complete rewrite." That is the developer's excuse to play with new toys. The fix is usually operational and architectural discipline:
- Phase 1 (Days 1-30): Financial Engineering. Purchase Savings Plans and Reserved Instances for steady-state workloads. Delete stale resources. Move infrequently accessed S3 data to "Glacier" storage tiers. Expected Savings: 15-20%.
- Phase 2 (Days 30-90): Rightsizing. Use AWS Compute Optimizer to identify over-provisioned instances and downsize them. If a server runs at 5% CPU utilization, cut its size in half. Expected Savings: 10-15%.
- Phase 3 (Days 90-180): Architectural Refactoring. This is the real work. Move background jobs to Lambda. Put databases on Amazon Aurora Serverless. Implement auto-scaling groups that actually scale down to zero at night.
The Due Diligence Ask
Before you sign the LOI, ask for the AWS Cost & Usage Report (CUR) for the last 12 months. If they hesitate or say it's "too complex," that's a red flag. A competent CTO knows exactly where the money is going.
Remember, every dollar you shave off the AWS bill is a dollar of pure EBITDA. In a market where multiple expansion is dead and growth is expensive, cloud efficiency is one of the few reliable levers left for value creation. Don't buy their bloat—price it in.