
The practical answer
- Short answer
- Stop overpaying for 'Cloud-First' acquisitions. Learn how to audit AWS/Azure spend, identify 32% waste, and optimize cloud unit economics before you sign.
- Best fit
- Industry: Private Equity / B2B SaaS. Function: Technology / Finance
- Operating path
- Technical Debt → Turnaround & Restructuring → Transaction Advisory Services
- Key metric
- 92% Elite Cloud Efficiency Rate (CER) benchmark for SaaS companies (Cloud Spend <8% of Revenue).
The 'Cloud-First' Valuation Gap
In 2025, 'Cloud-First' has become a dangerous synonym for 'Cost-Blind.' Private Equity sponsors often view cloud-native architecture as a hallmark of scalability and modernity. In reality, for many mid-market acquisitions, it is a source of silent EBITDA erosion. The assumption is that because a target isn't managing physical data centers, they are efficient. The data suggests the opposite.
According to 2025 benchmarks from Flexera and N2W Software, 32% of cloud budgets are wasted annually. For a SaaS company with $10M in hosting costs, that is $3.2M of pure margin leakage disguised as 'necessary infrastructure.' This waste rarely stems from malicious intent; it comes from 'Architectural OpEx'—the accumulated interest of rapid feature development prioritized over resource optimization.
The problem is compounded in 'Lift and Shift' scenarios, where legacy applications are moved to AWS or Azure without refactoring. These environments often run 24/7 on expensive on-demand instances, mimicking a data center environment but at cloud premium prices. During Technical Due Diligence (Tech DD), most audits focus on security posture and IP ownership. Few dig deep enough into Cloud Unit Economics to answer the critical question: Is this cloud bill growing linearly with revenue, or is it scaling efficiently?
Cloud waste isn't just about paying too much. It has knock-on effects: Forecasting and budget overruns... Spend wasted on non-critical stuff means less budget for innovation.
The Diagnostic: 4 Indicators of Infrastructure Inefficiency
When evaluating a 'Cloud-First' target, you must move beyond the aggregate monthly bill. A high bill isn't necessarily bad if it correlates with high transaction volume. The red flag is low Cloud Efficiency Rate (CER). Elite SaaS companies spend <8% of revenue on cloud infrastructure (CloudZero, 2025). If your target is spending 15%+, you are looking at a distressed asset or a massive optimization opportunity.
1. The 'Inactive' Resource Tax
Look for 'Inactive' infrastructure—resources that are running but doing nothing. Common culprits include unattached EBS volumes (hard drives with no computer), idle Load Balancers, and obsolete snapshots. In many due diligence audits, we find up to 15% of the bill is paying for resources that haven't processed a request in 90 days.
2. The Over-Provisioning Buffer
Developers often size instances for 'peak theoretical load' rather than 'actual average load.' This 'Safe Mode' tax means you are paying for 64GB of RAM when the application rarely exceeds 8GB. If the target lacks auto-scaling groups and relies on static, large instances, they are likely overpaying by 40-50%.
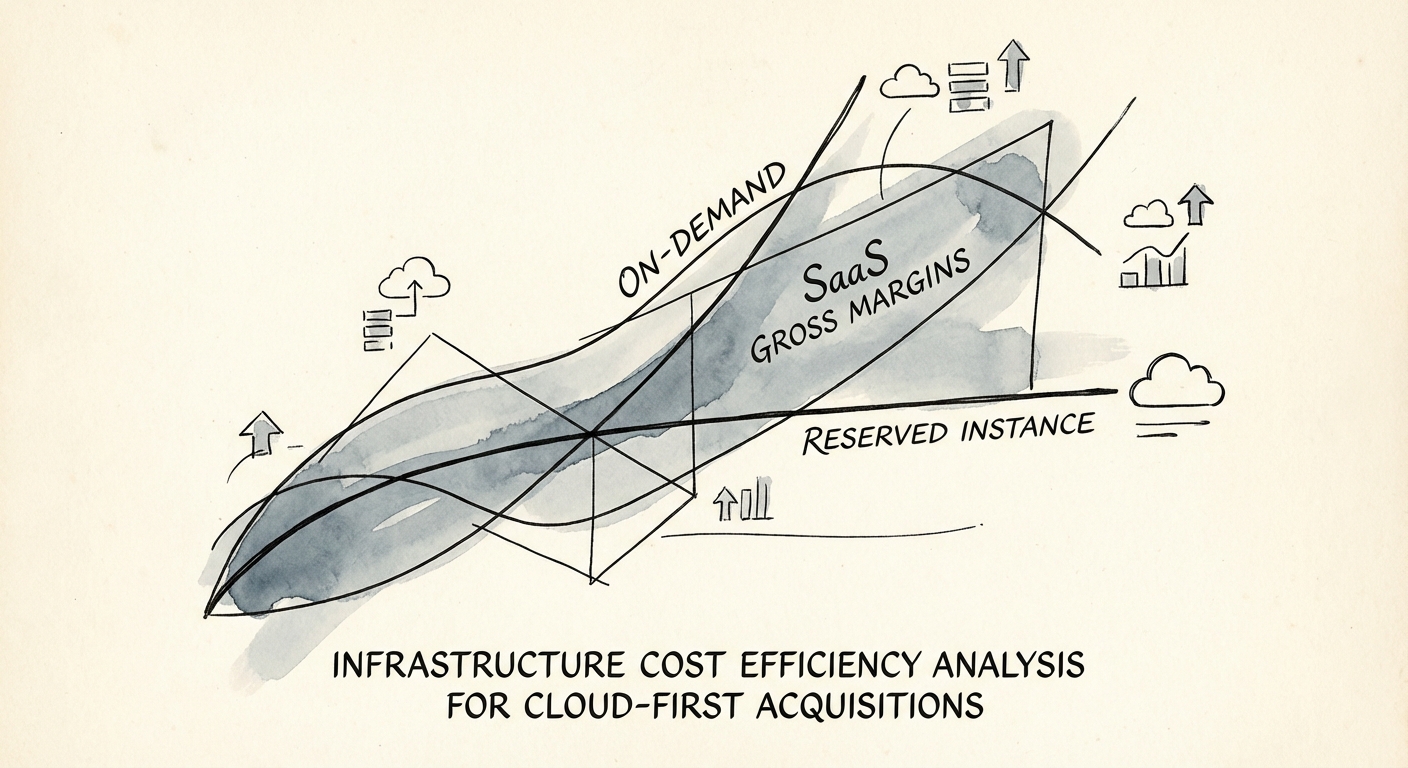
3. The On-Demand Addiction
Check the ratio of On-Demand vs. Reserved Instances (RIs) or Savings Plans. A mature cloud organization should have >70% coverage in committed spend models. If your target is running 90% On-Demand, they are effectively paying list price for a commodity that typically offers a 40-60% discount for commitment.
4. The Data Egress Trap
In multi-cloud or hybrid environments, data transfer fees (egress) can be a silent killer. If the architecture involves heavy movement of data between regions or providers without caching (CDNs), this line item can scale uncontrollably as customer usage grows.
Remediation: Turning FinOps into Value Creation
Identifying cloud waste is one of the fastest levers for EBITDA expansion in the first 100 days. Unlike headcount reductions, which carry cultural risk, or price increases, which carry churn risk, cloud optimization is purely operational. It improves margins without touching the customer experience.
The 100-Day FinOps Playbook
- Week 1-2: Install Visibility. You cannot fix what you cannot measure. Deploy a cloud cost intelligence tool (e.g., CloudZero, Vantage, or native Cost Explorer with proper tagging) to map spend to products, features, and teams.
- Week 3-6: The 'Low Hanging Fruit' Purge. Terminate all stale resources. Enforce data lifecycle policies to move old logs to cold storage (e.g., S3 Glacier). This typically yields 5-10% immediate savings.
- Week 7-10: Rightsizing & Commitments. Downsize over-provisioned instances based on actual CPU/RAM utilization data from the last 30 days. Once the fleet is right-sized, purchase 1-year Compute Savings Plans for steady-state workloads.
- Week 12+: Architectural Refactoring. For long-term value, identify 'heavy lifter' services that can be refactored to serverless or containerized models (Kubernetes) to allow for granular auto-scaling.
By treating cloud infrastructure as a variable cost that must be actively managed, PE firms can often unlock 2-4 percentage points of EBITDA margin within the first two quarters of ownership.