The practical answer
- Short answer
- Stop buying 'lift-and-shift' liabilities. This guide provides a 5-point framework to quantify Azure technical debt and uncover hidden EBITDA in portfolio companies.
- Best fit
- Industry: Private Equity. Function: Technology Due Diligence
- Operating path
- Technical Debt → Turnaround & Restructuring → Transaction Advisory Services
- Key metric
- 32% Average wasted cloud spend reported by organizations in 2025 (Flexera State of the Cloud Report).
The $2M 'Cloud Modernization' That Was Actually a Landfill
The pitch deck said the target company was "cloud-native." They had migrated 100% of their infrastructure to Azure in 2024. The CIO boasted about retiring the data center. The deal team saw "scalability."
I saw a burning pile of cash.
We ran our standard Azure Technical Debt Diagnostic during the exclusivity period. The findings were brutal. The company hadn't "modernized" anything; they had simply forklifted their messy, oversized on-premise servers directly into the cloud. They were running virtual machines (VMs) designed for peak 2019 Black Friday traffic, 24/7/365, to host internal admin tools used by three people.
The result? 32% of their monthly cloud invoice was pure waste.
This isn't an anomaly. According to the Flexera 2025 State of the Cloud Report, organizations self-estimate that 32% of their cloud spend is wasted. In the lower-middle market, where governance is scarce and "speed to cloud" was the only KPI, that number frequently tops 50%.
For a PE sponsor, this is critical. If you are buying a company with $5M in Azure spend, you are likely inheriting $1.6M of annual waste. That is $1.6M of potential EBITDA suppressed by technical debt disguised as "infrastructure costs." You don't need a code audit to find this; you need a Governance Gap Analysis.
If you are buying a company with $5M in Azure spend, you are likely inheriting $1.6M of annual waste. That is $1.6M of potential EBITDA suppressed by technical debt.
The Diagnostic: 5 Signs of 'Inactive' Azure Infrastructure
When evaluating a target's Azure environment, do not let the CTO drown you in architecture diagrams. Ask for read-only access to their Azure Cost Management (ACM) or Azure Advisor portal. If they refuse, that is a red flag. If they grant it, look for these five value-killers:
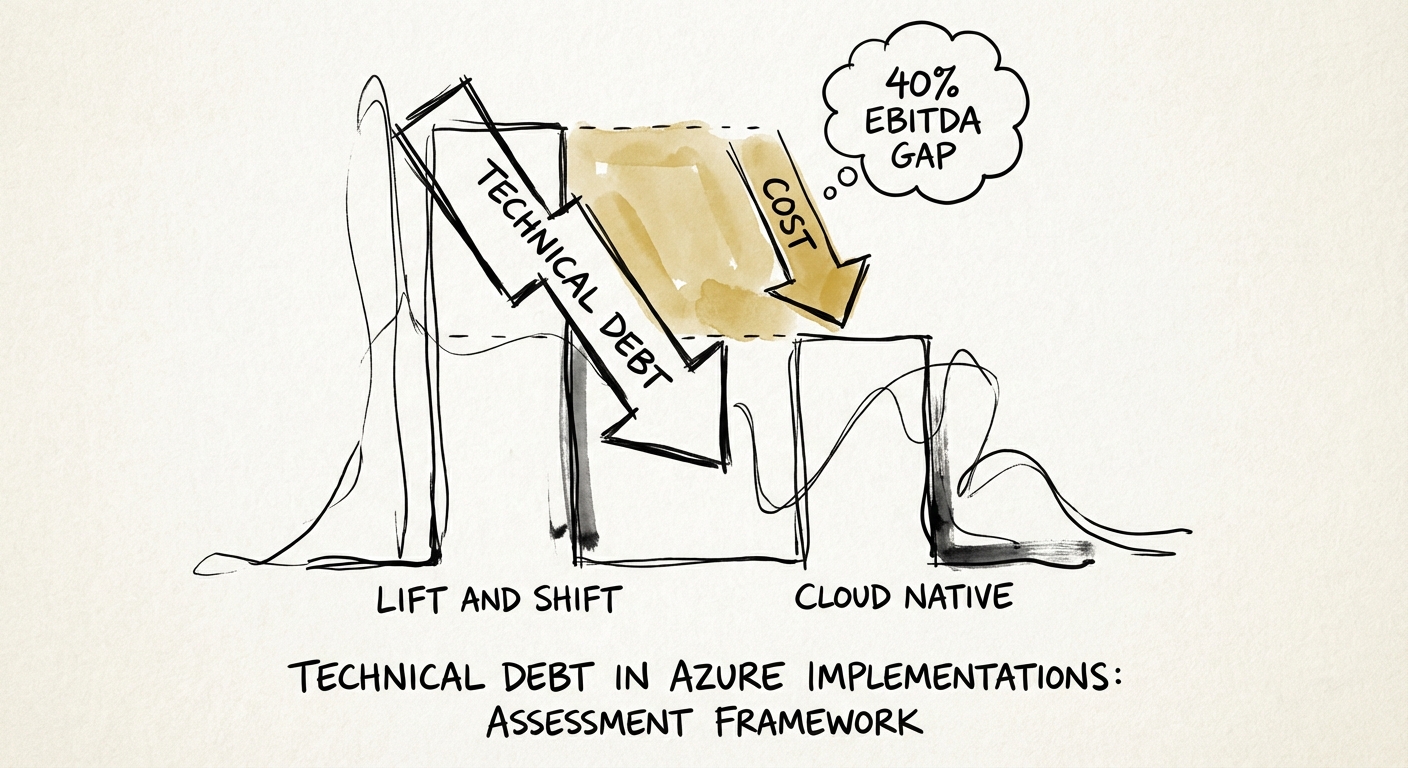
1. The 'Lift and Shift' Hangover (Oversized VMs)
On-premise hardware is a sunk cost; you paid for the box, so you might as well use the biggest one. In Azure, you pay by the minute and by the core. We frequently see Series B and C companies running D-Series or E-Series VMs with average CPU utilization below 5%. This is the "Lift and Shift" tax. If the migration strategy was "move it fast and fix it later," they never fixed it.
2. Orphaned Disks and Snapshots
When a developer deletes a Virtual Machine in Azure, the attached storage disk is not deleted by default. It sits there, unattached, billing the company monthly for data that is being accessed by no one. In one recent due diligence, we found 400 TB of unattached Premium SSD storage costing the target $45,000 per month. That's $540k/year in pure EBITDA leakage.
3. The Hybrid Benefit Gap
Microsoft offers a mechanism called "Azure Hybrid Benefit," allowing companies to bring their existing on-premise Windows Server and SQL Server licenses to the cloud to save up to 40% on compute costs. Yet, 45% of eligible workloads we audit are paying full retail price because the engineering team "forgot" to check a box in the configuration portal.
4. 'Inactive' Development Environments
Look for Resource Groups named "Dev," "Test," or "POC" that haven't registered activity in 90 days but are still incurring charges. Developers spin up expensive environments to test a feature, get distracted, and leave the meter running. This is the digital equivalent of leaving the manufacturing plant lights on all weekend, every weekend.
The Remediation: Turning Waste into Multiple Expansion
The good news? This is the easiest value creation lever you will ever pull. Unlike revenue synergies, which are speculative, Azure waste reduction is deterministic. It hits the P&L immediately.
We recommend a three-phase remediation plan for the first 100 days post-close:
- Day 1-30: Stop the Bleeding (The 'Kill' Phase). Implement automated policies to delete orphaned disks and snapshots. Shut down non-production VMs between 7 PM and 7 AM (saving ~40% on those resources instantly). Enable Azure Hybrid Benefit for all eligible Windows/SQL workloads.
- Day 31-60: Right-Sizing (The 'Shrink' Phase). Use Azure Advisor data to downsize VMs. If a machine has peaked at 10% CPU for 30 days, cut its allocation in half. Move rarely accessed data from Hot Storage to Cool or Archive tiers.
- Day 61-90: Reserved Instances (The 'Lock' Phase). Once the environment is stable and right-sized, commit to 1-year or 3-year Reserved Instances (RIs) for the remaining steady-state workloads. This yields savings of 30-50% compared to pay-as-you-go pricing.
The Bottom Line: Technical debt in Azure isn't just an engineering nuisance; it's a valuation anchor. A $10M ARR SaaS company wasting $500k on Azure is surrendering ~$5M-$8M in Enterprise Value at exit. Treat cloud governance as a financial discipline, not an IT ticket.