
The practical answer
- Short answer
- Use the Burn Multiple formula to evaluate capital efficiency in 2026. See why investors scrutinize companies above 1.5x at the Series B stage.
- Best fit
- Industry: B2B SaaS. Function: Finance
- Operating path
- Financial Infrastructure → Commercial Performance → Valuations
- Key metric
- 1.5x Target Burn Multiple for Series B
Efficient Growth Is Back in Focus
For a decade, the advice to Series B founders was simple: Triple, triple, double, double, double. If you hit the growth numbers, the burn often received less scrutiny because another round looked available. That market changed when capital became more selective.
Today, growth without efficiency is not an asset; it is a liability. Investors have added the Burn Multiple to the finance dashboard because it is harder to hide behind one-time revenue spikes or headline growth. It answers a practical question: "How much net cash burn is required to generate $1 of net new ARR?"
If you are a founder with $10M-$50M ARR and a stalled Series C conversation, this metric is a useful diagnostic. It shows whether your Go-To-Market (GTM) engine is producing efficient revenue or consuming too much capital for each incremental dollar. In 2026, the market rewards efficient growth. If a competitor is scaling with a Burn Multiple near 1.0x while you are operating at 2.5x, the financing discussion becomes materially harder.
Investors are asking a different question in 2026: can you grow without consuming capital faster than the business model can justify?
The Formula and the 2026 Benchmarks
The Burn Multiple was popularized by David Sacks of Craft Ventures, and it is now widely referenced across the venture landscape. The formula is simple:
Burn Multiple equals net burn divided by net new ARR
Net Burn: The total cash your company burned in a given period (revenue minus all expenses).
Net New ARR: The actual new recurring revenue added in that same period (new logo ARR + expansion ARR - churn ARR).
Note the denominator: it is net new ARR, not gross. If your sales team brings in $2M in new bookings, but you churn $1M from existing customers, your net new ARR is only $1M. Churn directly worsens the efficiency score.
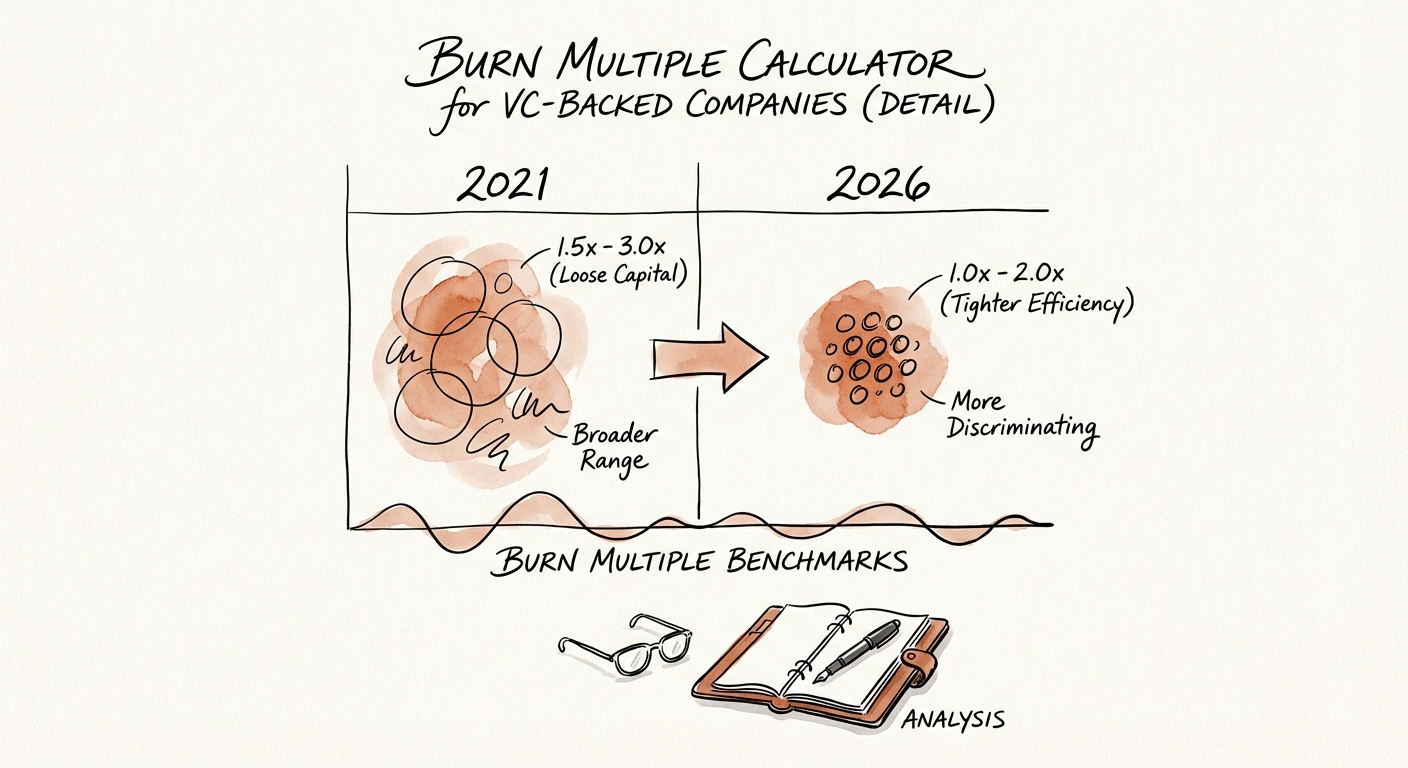
The 2026 Benchmark Scale
Based on SaaS efficiency benchmarks from Scale Venture Partners and ICONIQ Growth, the bar has moved. What was considered acceptable in 2021 receives more scrutiny now.
- Under 1.0x: You are generating more ARR than you burn. This is the strongest zone, often driven by leaner operating models.
- 1.0x-1.5x: The target zone for healthy Series B companies. You are investing in growth, but the unit economics are sound.
- 1.5x-2.0x: Investors will want a clear explanation. If your growth rate is very high, this may be acceptable. If growth has slowed, it becomes a problem.
- Over 2.0x: The company is burning more than $2 to create $1 of net new ARR. Unless you are in deep R&D mode, this points to a GTM or retention issue.
- Over 3.0x: The business model needs immediate operating review. You may be buying revenue with unsustainable CAC.
For a deeper dive into how runway math interacts with these metrics, review our guide on Burn Rate vs. Growth Rate.
How to Fix a Weak Burn Multiple
If the formula shows a 2.5x Burn Multiple, you cannot simply cut your way to 1.0x. Slashing sales and marketing spend will reduce net burn, but it may also reduce net new ARR, leaving the multiple unchanged or worse. The operating model has to improve.
1. Fix the Retention Leak
Since the denominator is net new ARR, churn has a direct impact on your efficiency score. Reducing churn by 10% is often cheaper and faster than increasing sales bookings by 10%. Before reducing sales capacity, fix your customer success and retention loops. High churn makes an efficient Burn Multiple mathematically difficult.
2. Audit Your CAC Payback
A high Burn Multiple is often a symptom of a long CAC Payback Period. If it takes 24 months to recover the cost of acquiring a customer, your cash burn will remain high even as you grow. Shift marketing spend toward channels with faster payback and reduce campaigns that cannot be tied to pipeline or retention.
3. Remove Founder Bottlenecks
Inefficiency often comes from founders holding too many approval rights, creating bottlenecks that slow deal velocity. Cleaner board reporting and delegation can speed up decisions and reduce the time tax on every dollar of revenue. Ensure your finance function reports Burn Multiple monthly, not just quarterly, so you can course-correct early.
Conclusion: The Efficiency Moat
In 2026, capital efficiency is a moat. Companies with a Burn Multiple under 1.0x control more of their own financing destiny because they are less dependent on the next round. Companies above 2.5x need a credible operating plan. Run the numbers, find the drivers, and address the constraints before the financing conversation forces the issue.