
The practical answer
- Short answer
- Learn how R&D, Sales and Marketing, and G&A ratios should change as B2B SaaS companies move from sub-$20M ARR to $50M+ ARR.
- Best fit
- Industry: B2B SaaS. Function: Finance
- Operating path
- Financial Infrastructure → Commercial Performance → Valuations
- Key metric
- 3 ratios Sales and Marketing, R&D, and G&A should be reviewed by scale stage.
SaaS operating expense ratios need to match scale stage. A $15M ARR company that copies the expense profile of a $100M ARR company can overbuild G&A, underfund product velocity, or spend too much on sales and marketing before the unit economics can support it. The result is not sophistication. It is a burn-rate problem.
At sub-$20M ARR, the finance question is not whether the company has every executive function a public software company would carry. The question is whether each dollar of operating expense improves product velocity, retention, or efficient new ARR. Sales and marketing can be high at this stage, but the payback period and channel mix need close inspection.
The correct approach is to define stage-appropriate guardrails for Sales and Marketing, Research and Development, and General and Administrative expense, then review them against growth rate, gross retention, and cash runway. If operating expenses are out of alignment, every dollar of new revenue can compound the inefficiency and force more dilutive financing than the business should need.
SaaS operating expense ratios are only useful when they match the company's scale stage, growth rate, retention profile, and cash runway.
The Inflection Point of Operating Leverage ($20M to $50M ARR)
The operating math changes as a SaaS company moves through the $20M to $50M ARR band. Pure growth gives way to unit-economic scrutiny, and buyers begin calculating baseline EBITDA more seriously. In this scale band, leadership needs to isolate pure software gross margin, services margin, customer support costs, and G&A efficiency rather than letting everything sit in a blended expense view.
Sales and marketing spend should also change composition. Early brute-force outbound motions should give way to channels, expansion, partner leverage, and account-management motions that improve net revenue retention. The R&D ratio may naturally decline as revenue grows, but the company still needs enough product investment to protect roadmap velocity and competitive differentiation.
Companies that fail to cross this operating-leverage point can become too large to be valued only for technology and too inefficient to earn a premium financial buyer multiple. The practical work is quote-to-cash discipline, commission governance, budget-versus-actuals review, and back-office processes that do not scale linearly with headcount.
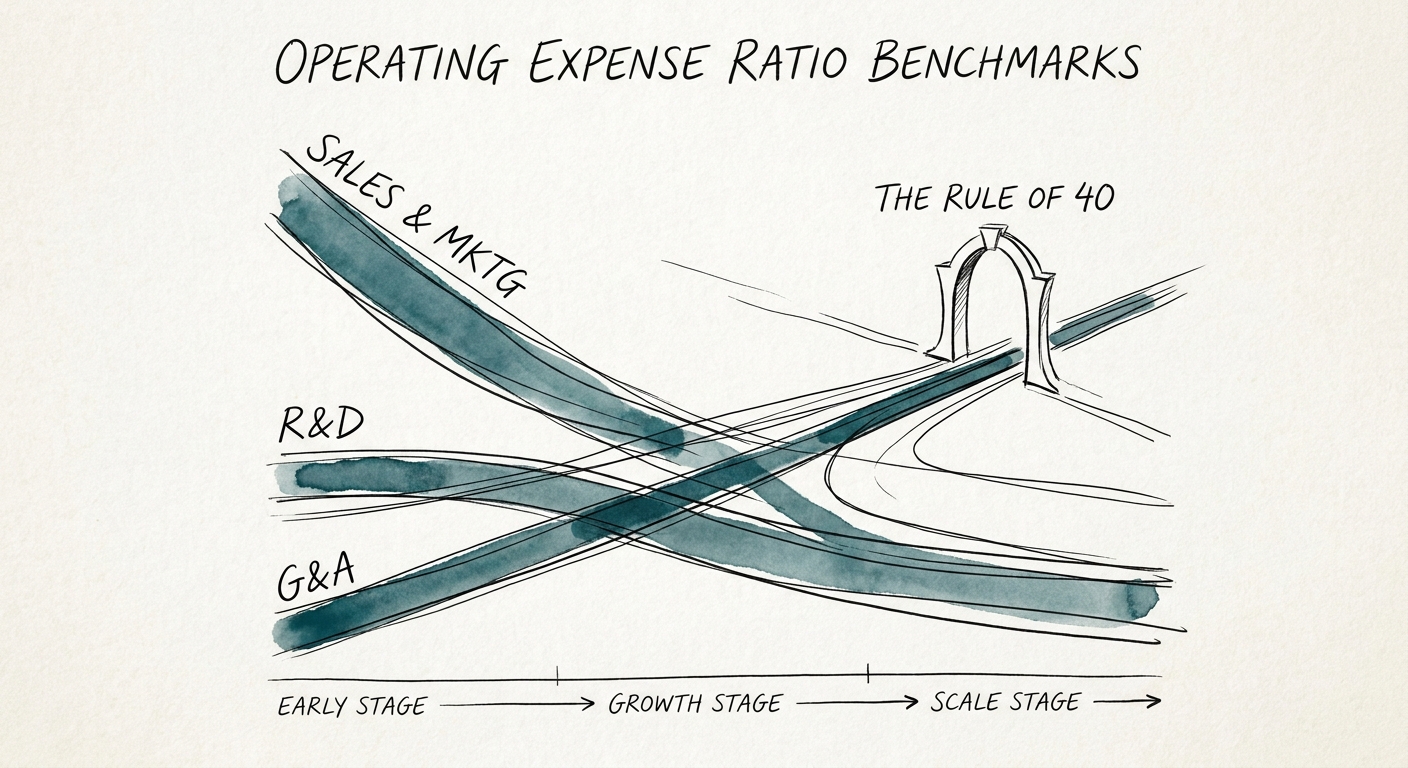
The Rule of 40 Stage ($50M+ ARR)
When a company crosses $50M ARR, it is no longer managed like an early startup. Buyers and boards expect a clearer relationship between growth, free cash flow, and operating expense ratios. The Rule of 40 becomes a useful lens, even if the exact balance between growth and profitability varies by market position.
At this stage, Sales and Marketing, R&D, and G&A should each have explicit targets, variance thresholds, and owners. G&A in particular needs discipline: too much back-office cost can make strong gross margins look weaker than they should. The goal is not indiscriminate cost cutting. It is predictable operating leverage.
The strongest companies can forecast operating expense with enough accuracy to make quarterly decisions before the board asks. They know which functions should scale with revenue, which should scale with headcount, and which should not scale much at all. At this plateau, the competitive moat is not only the software product; it is the financial infrastructure that lets the business grow without losing control of margin quality.