The practical answer
- Short answer
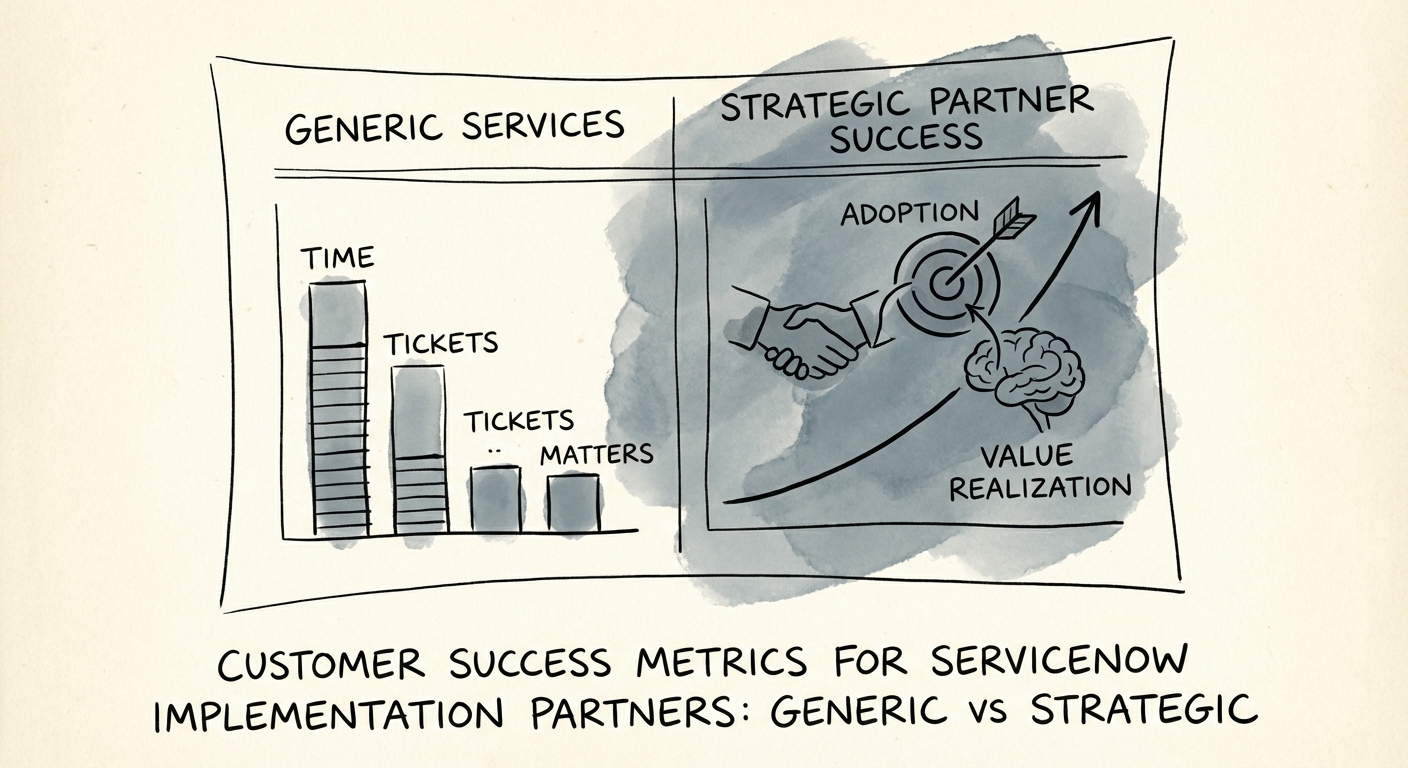
- Stop tracking just 'on-time delivery.' Here are the 5 Customer Success metrics ServiceNow implementation partners must track to retain Elite status and drive valuation.
- Best fit
- Industry: IT Services / SaaS Implementation. Function: Customer Success
- Operating path
- Revenue Architecture → Commercial Performance → Office of the CFO
- Key metric
- 22% of ServiceNow's Net New ACV was partner-sourced in Q2 2025.
The 'Delivery' Trap: Why Your Metrics Are Killing Your Partner Status
If you run a ServiceNow implementation firm, you likely live and die by two metrics: Gross Margin and Utilization. These are the heartbeat of any professional services firm. They tell you if you are profitable today. But they tell you absolutely nothing about whether you will be in business tomorrow.
Here is the reality of the 2026 ServiceNow Partner Program: ServiceNow does not care about your utilization rate. They care about their Net New Annual Contract Value (ACV) and their logo retention. If your implementation delivers the project “on time and on budget” but the customer fails to adopt the platform, you have failed in the eyes of the vendor.
We see this constantly with founders in the $10M–$50M range. You built your reputation on technical excellence. Your architects are brilliant. But your “Customer Success” function is really just “Project Management” in disguise. You measure success by Go-Live. ServiceNow measures success by Consumption.
This misalignment is dangerous. ServiceNow’s recent partner program updates have rigorously prioritized “Customer Success” outcomes over volume. The new “Global Elite” and “Elite” tiers require consistent CSAT scores above 4.5. If you are operating with a “delivery mindset”—finish the ticket, close the project, move to the next—you are practically invisible to the ServiceNow sales reps who control your deal flow.
The “Body Shop” Valuation Discount
When Private Equity looks at a ServiceNow partner, they look for recurring revenue and IP. If your CS metrics are purely transactional (e.g., “Project Completion Rate”), you are valued as a low-margin staffing agency (4x–6x EBITDA). If your CS metrics prove adoption, expansion, and retention, you start looking like a platform extension (10x+ EBITDA).
The 5 Metrics That Actually Matter for ServiceNow Partners
Stop tracking generic SaaS metrics like “DAU/MAU” (you don't own the product) or generic services metrics like “Billable Hours” (that's an input, not an outcome). Here is the diagnostic dashboard for high-performing partners.
1. Partner CSAT (The Gatekeeper)
Benchmark: >4.6/5.0
ServiceNow’s partner finder explicitly ranks you by CSAT. In 2025, the average for Elite partners hovered around 4.4. To differentiate, you need to be at 4.6 or higher. Crucially, this isn't just “did they like the consultant?” The survey asks about business outcomes. If you implemented technical perfection but the client didn't see ROI, your CSAT tanks.
Diagnostic Question: Are you surveying at “Go-Live” (honeymoon phase) or 90 days post-launch (reality phase)?
2. Net New ACV Sourced (The Growth Engine)
Benchmark: 20%+ of Total Revenue
ServiceNow tracks exactly how much license revenue you bring to the table. This is “Co-Sell” or “Partner Sourced” revenue. If you rely 100% on ServiceNow reps to hand you leads, you are a commodity. The best partners generate their own demand. In Q2 2025, partners sourced 22% of ServiceNow’s net-new ACV. If you aren't bringing deals, you aren't a partner; you're a vendor.
3. Project-to-CIM Conversion Rate
Benchmark: 40%+
This is the “Land and Expand” metric for services. What percentage of your implementation projects convert into a Continuous Improvement Management (CIM) or Managed Services contract? This is how you escape the “feast or famine” cycle of project work. A one-off implementation is a failure of Customer Success. A successful implementation naturally leads to a “Phase 2” or a support retainer.
4. License Consumption / Adoption Rate
Benchmark: 85% of Purchased Seats Active
You don't own the software, but you are responsible for it being used. If a client buys ITSM Pro but only uses Incident Management (and ignores Problem/Change), they will down-sell at renewal. Your CS team must track feature adoption. Are they using the “Pro” features they paid for? If not, you are at risk of a “Red Account” status with ServiceNow.
5. AI & GenAssist Attach Rate
Benchmark: 30% of Projects
With 40% of net-new AI ACV being partner-sourced in 2025, this is the new gold standard. Are you just lifting and shifting legacy processes, or are you implementing Now Assist and GenAI capabilities? Partners who attach AI to their implementations are seeing 2x higher bill rates and deeper stickiness.
Execution: Moving from “Delivery” to “Success”
Knowing the metrics is easy. Changing your behavior is hard. Most ServiceNow partners have a “Sales” team and a “Delivery” team. They lack the connective tissue of “Customer Success.”
Step 1: Bifurcate Project Managers and Customer Success Managers
Do not ask your Project Managers (PMs) to do Customer Success. PMs are incentivized to finish (on time/budget). CSMs must be incentivized to expand (adoption/value). If you combine these roles, the urgent (deadlines) will always drown out the important (strategy). A dedicated CSM should own the account relationship alongside the PM during delivery and after go-live.
Step 2: Align Comp Plans to Co-Sell
Your CSMs shouldn't just be paid on retention; they should be paid on ACV Sourced. If a CSM identifies an opportunity for HR Service Delivery (HRSD) in an existing ITSM account and brings in the ServiceNow rep, that CSM should get a spiff. This behavior aligns your firm with ServiceNow’s growth goals, ensuring their reps keep feeding you deals.
Step 3: The “QBR” is Not a Status Report
Most partner QBRs are boring recaps of tickets closed. Stop that. A QBR should be a Roadmap Review.
“You are currently at Maturity Level 2. To get to Level 3 and unlock $X in savings, we need to implement these three modules.”
This turns a support meeting into a sales meeting, driven by value, not by hours.
Summary
The difference between a $20M services firm that sells for 6x and one that sells for 12x is the quality of revenue. High CSAT, high recurring managed services, and high co-sell activity prove to a buyer that you have a defensive moat. Stop measuring yourself like a contractor. Start measuring yourself like a strategic partner.