The practical answer
- Short answer
- 2025 benchmarks for Google Cloud Partner utilization. Why the industry average of 68.9% is a danger signal for EBITDA, and how to target 78%+. Operational diagnostic for founders.
- Best fit
- Industry: Cloud Consulting. Function: Operations
- Operating path
- Unit Economics → Commercial Performance → Transaction Advisory Services
- Key metric
- 68.9% Avg. 2025 Billable Utilization (Down from 73% in 2023)
The Multiplier Trap: Why You're Bleeding Cash While Growing
You’ve read the IDC report: for every $1 of Google Cloud consumption sold, partners generate $7.05 in downstream services revenue. It is the most seductive statistic in the ecosystem. It convinces founders like you to hire expensive, multi-certified Professional Cloud Architects before the ink is dry on the SOW.
But here is the reality check that doesn't make it into the slide deck: The 2025 Professional Services Maturity Benchmark reveals that average billable utilization has plummeted to 68.9%.
For a founder-led GCP shop doing $10M-$50M, this is not a "soft patch." It is a math problem that kills exits. At 68.9% utilization, you are barely covering the burdened cost of that expensive engineering talent. You are likely seeing EBITDA margins compress to single digits (9.8% is the new industry average), even as your top-line revenue looks healthy.
The problem is rarely lack of demand. The problem is Operational Latency. You are carrying "innovation capacity"—engineers hired for GenAI and Data Modernization projects—who are sitting on the bench waiting for the "Migrate" phase to finish. You are paying senior wages for what is effectively a waiting room.
If your Practice Lead is billing 80% of the time, you don't have a Practice Lead. You have a highly paid individual contributor.
The New Rules: 2026 Utilization Benchmarks
The days of a flat "75% utilization target" across the firm are over. If you demand 75% from your Principal Architect, they will stop selling. If you accept 75% from your Junior Developer, you are lighting money on fire.
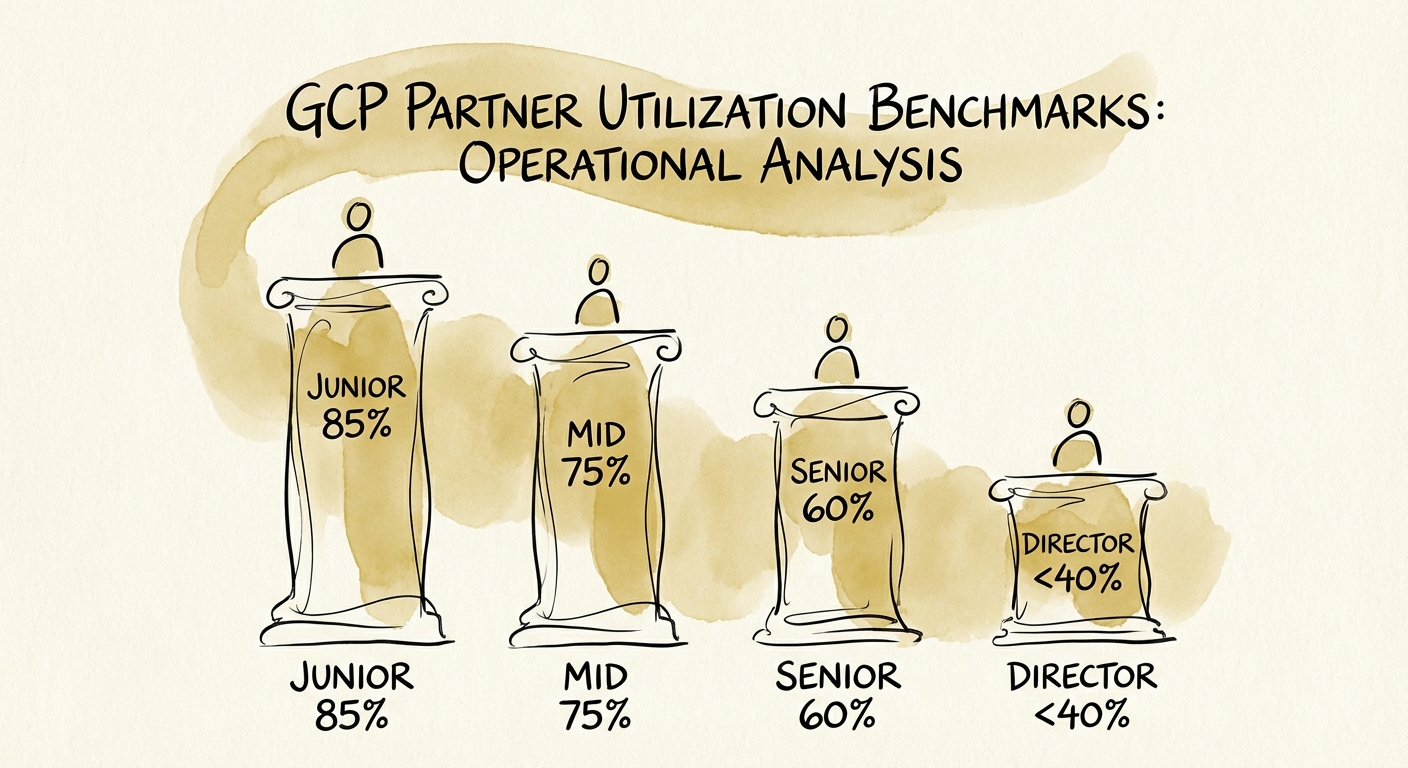
Based on high-performance firms (those achieving >20% EBITDA), here are the role-based utilization targets you need to enforce in your GCP practice:
- Junior Engineers / Analysts: 85% - 90%
Their only job is delivery. If they are not billing, they are burning cash. Shield them from internal meetings, presales, and "culture" initiatives. - Mid-Level Engineers (Cloud Engineers): 75% - 80%
The workhorses of your migrations. They should have limited non-billable time for upskilling (Google releases 100+ updates a month), but execution is primary. - Senior Architects / Leads: 60% - 65%
This is where most firms fail. You push them to 80%, and suddenly your pipeline dries up because your best technical sellers are stuck writing Terraform scripts. Their value is in scoping and QA, not just billing hours. - Practice Leads / Directors: <40%
If your Practice Lead is billing 80% of the time, you don't have a Practice Lead. You have a highly paid individual contributor.
The Burnout Ceiling
Note the ceiling. Firm-wide utilization above 83% is not a badge of honor; it is a leading indicator of attrition. In the GCP ecosystem, where talent is scarce and recruiters are aggressive, burning out your team to hit a quarterly number is a short-term trade with a long-term penalty.
Operational Rigor: Fixing the Forecast
Utilization is a lagging indicator. By the time you see the 68% on your dashboard, the money is already gone. To fix this, you must shift to Forecasted Utilization.
Implement the "4-Week Lookahead" protocol immediately:
- The Friday Lock: Every Friday, resource allocations for the next 4 weeks are locked in your PSA (Professional Services Automation) tool. "Unassigned" is not a valid project code.
- The Variance Meeting: Monday morning operations meetings are not for status updates. They are for Variance Analysis. Why was the architect forecasted at 100% last week but only billed 80%? Was it scope creep? Client delay? Or poor estimation?
- The "Ghost" Check: Audit your "Internal Projects." Often, 15% of your capacity is hiding in vague internal initiatives like "Asset Development" or "Training" that have no ROI. If it's not billable and it's not a strategic IP build with a launch date, remove it.
Your goal is not just to be busy. It is to be profitably busy. In the current M&A market, buyers are scrutinizing Quality of Earnings (QofE). A firm with 78% utilization and 20% EBITDA trades at a premium. A firm with 68% utilization and 10% EBITDA gets a low-ball offer—or no offer at all.