The practical answer
- Short answer
- A $45M SaaS carve-out's "weekly" flash report took 38 hours to compile. Why dashboard build time, not your calendar, decides whether you can steer a portfolio company.
- Best fit
- Industry: B2B Software & Technology Services. Function: Data Analytics & RevOps
- Operating path
- Financial Infrastructure → Commercial Performance → Valuations
- Key metric
- 60% Drop in executive dashboard adoption when query response times exceed 10 seconds.
The "weekly" report that was already three days stale
I walked into a $45M SaaS carve-out where the finance team proudly ran a weekly flash report. It landed in the operating partner's inbox every Thursday afternoon. The problem: building it took two analysts roughly 38 hours of manual ETL — exporting from the CRM, reconciling against the ERP, hand-mapping the HRIS headcount file, and stitching it all together in a 14-tab Excel workbook. By the time Thursday's report shipped, the data inside it was a snapshot of the previous Sunday. They weren't reporting weekly. They were reporting on a four-day delay and calling it weekly.
This is the trap that catches almost every company in the $20M-$150M ARR band. Your reporting cadence is not a policy decision you make in a board deck. It's a math problem dictated by how long your dashboard takes to assemble end to end. And "load time" is the wrong way to think about it — most people picture the 15 seconds an executive waits for a Power BI screen to paint. That matters (Eckerson Group research ties a 60% collapse in dashboard adoption to query responses slower than 10 seconds), but it's the small number. The number that governs your cadence is the full compilation cost: the human and machine hours between "data exists in source systems" and "a partner can act on it."
Do the arithmetic on that carve-out. Thirty-eight hours of manual compilation, performed by people who also have a month-end close to run, cannot be repeated every five business days without burning the team out. So the cadence quietly drifts to monthly. The partner stops getting weekly signal not because anyone decided monthly was enough, but because the pipeline physically couldn't sustain weekly. You end up managing a nine-figure asset through the rearview mirror, and you didn't even choose to.
Your reporting calendar is a lie your pipeline tells you. If the dashboard takes 38 hours to assemble, you don't have a weekly cadence — you have a monthly autopsy with a Thursday timestamp.
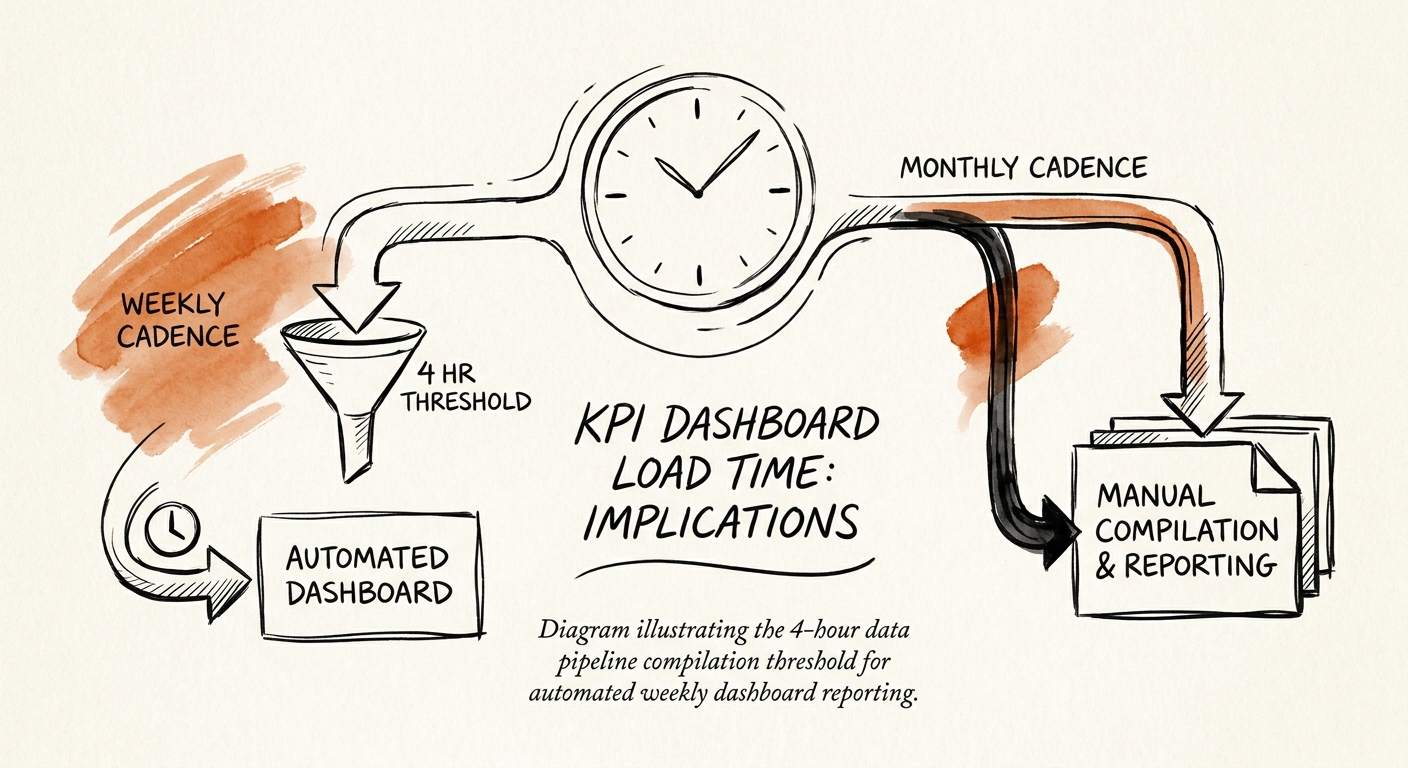
The Sunday-night window is the whole game
Here's the threshold that separates a real weekly cadence from a fake one. For a Monday-morning operating review to run on current data, every source system has to be ingested, normalized, and rendered before the partner opens the dashboard — and that has to happen automatically, overnight, with no analyst awake to babysit it. In practice that gives you the window from roughly Sunday midnight to about 4:00 AM Monday. If your end-to-end compilation can't finish inside that window, a human has to fill the gap, and the moment a human enters the loop you've reintroduced a 12-to-24-hour delay. Four hours of unattended compilation is the line. Above it, "weekly" requires heroics; below it, weekly is just what happens while everyone sleeps.
The reason this matters isn't tidiness — it's the difference between steering and grading. A monthly close tells you what already happened to EBITDA. A genuine weekly view shows you the leading indicators while you can still bend them. McKinsey's work on the data-driven enterprise found organizations with automated, near-real-time KPI visibility growing EBITDA at materially higher rates than peers stuck on traditional monthly closes. Picture the practical version: professional-services utilization slips on a Tuesday. If you see it Tuesday, you pause a contractor renewal or shift two consultants onto billable work that same week. If you see it 18 days after month-end, the quarter's margin is already set and you're explaining a covenant miss to the lender instead of preventing it.
Why your warehouse can't make the window
When a portfolio company misses the Sunday-night window, the cause is almost always the same architectural sin: the visualization tool is doing the heavy lifting. I keep finding Tableau and Power BI instances pointed straight at 30 to 50 million rows of live transactional data so an executive can see a single summary tile. Every screen load re-runs that query against raw tables, which is how a "weekly dashboard" turns into a 45-second spinner. Executives don't wait 45 seconds. They close the tab, Slack the VP of Finance for "just a quick spreadsheet," and within a week you've rebuilt the exact shadow reporting the dashboard was supposed to kill. The slow query didn't just annoy people — it quietly relocated the source of truth back into someone's inbox.
Move the work to the warehouse, then defend the window
The fix is structural, not a bigger BI license. Push every expensive computation out of the visualization layer and into the data warehouse, then have the warehouse pre-compute your weekly metrics overnight into materialized views. By the time the dashboard wakes up Monday, it should be reading from summarized tables that already hold the answers — never scanning raw transactional rows live. In the carve-out, that single shift took compilation from 38 human hours to about 14 unattended machine minutes, and screen render dropped from tens of seconds to under three. That three-second mark isn't arbitrary: Gartner treats roughly three seconds as the ceiling for holding executive engagement. Cross it and you train your C-suite to stop opening the report at all.
What this buys you at exit
The visibility you gain Monday-to-Monday is the obvious win. The quieter one shows up in diligence. A 2026 buyer's operations team will look hard at your financial infrastructure, and a management team running a true automated weekly cadence reads very differently from one that produces a hand-assembled monthly deck. The first signals operational control and a forecast they can trust; the second signals that nobody can answer a question without a three-day fire drill. You don't have to say "our pipeline is slow" out loud — a stale dashboard says it for you. Tight, automated reporting is one of the cheapest credibility signals you can build before a process starts.
If you want to do this Monday: pull one number first — the wall-clock hours between your last source-system cutoff and the moment a partner could actually act on the report. If it's over four, you're on a monthly cadence no matter what the calendar invite says. Then decide which handful of metrics genuinely need weekly steering before you re-architect anything, because building overnight materialized views for forty vanity tiles is just expensive theater. Our portfolio company dashboard guide covers which metrics earn a place in the weekly view, and the board reporting framework sorts what belongs on a weekly cadence versus a monthly or quarterly one. Get the metric list right, move the compute to the warehouse, defend the Sunday-night window — and your reporting calendar stops being a wish and starts being a fact.