
The practical answer
- Short answer
- Your portfolio company is paying double-digit interest while financing its own customers for 90 days. Here's how to free 8% of revenue from the cash conversion cycle.
- Best fit
- Industry: Private Equity. Function: Finance
- Operating path
- Financial Infrastructure → Commercial Performance → Valuations
- Key metric
- 10% Percentage of total portfolio company revenue that can be unlocked for strategic reinvestment via comprehensive working capital optimization.
Here is the math nobody puts on the QBR slide. A portfolio company books a seven-figure enterprise logo, the sales team rings the bell, and the deck shows ARR climbing. Then collections takes 90 days to turn that invoice into cash, the company draws on its revolver at 11% to cover payroll in the meantime, and the "win" quietly becomes a 90-day, double-digit loan you extended to your own customer using your lender's money. Growth on the top line, hemorrhage on the cash line. The sponsor sees the bookings; almost nobody is watching the gap between booking and bank deposit.
When debt was cheap, you could paper over that gap with the revolver and never feel it. At today's borrowing costs you feel every day of it. The cheapest capital available to a portfolio company isn't a fresh equity tranche or a covenant-light add-on facility — it's the cash already sitting inside a bloated cash conversion cycle, costing nothing to release and zero dilution to deploy. KPMG's 2025 research on how leading sponsors use working capital puts the prize at up to 10% of portfolio company revenue freed for strategic reinvestment. Yet the working capital line is the one operating partners reflexively skip, because it doesn't show up in a multiple and it isn't anyone's bonus target. Free that cash and it lands directly on the EBITDA bridge — paying down the most expensive debt on the cap table, self-funding a bolt-on, or buying a platform investment without ever picking up the phone to call LPs for capital.
A sales rep books a seven-figure logo, the whole firm celebrates, and then finance waits 90 days to get paid while you cover the gap at 11%. That deal didn't fund growth. It financed your customer's balance sheet with your lender's money.
The cash conversion cycle is an operations metric wearing a finance costume
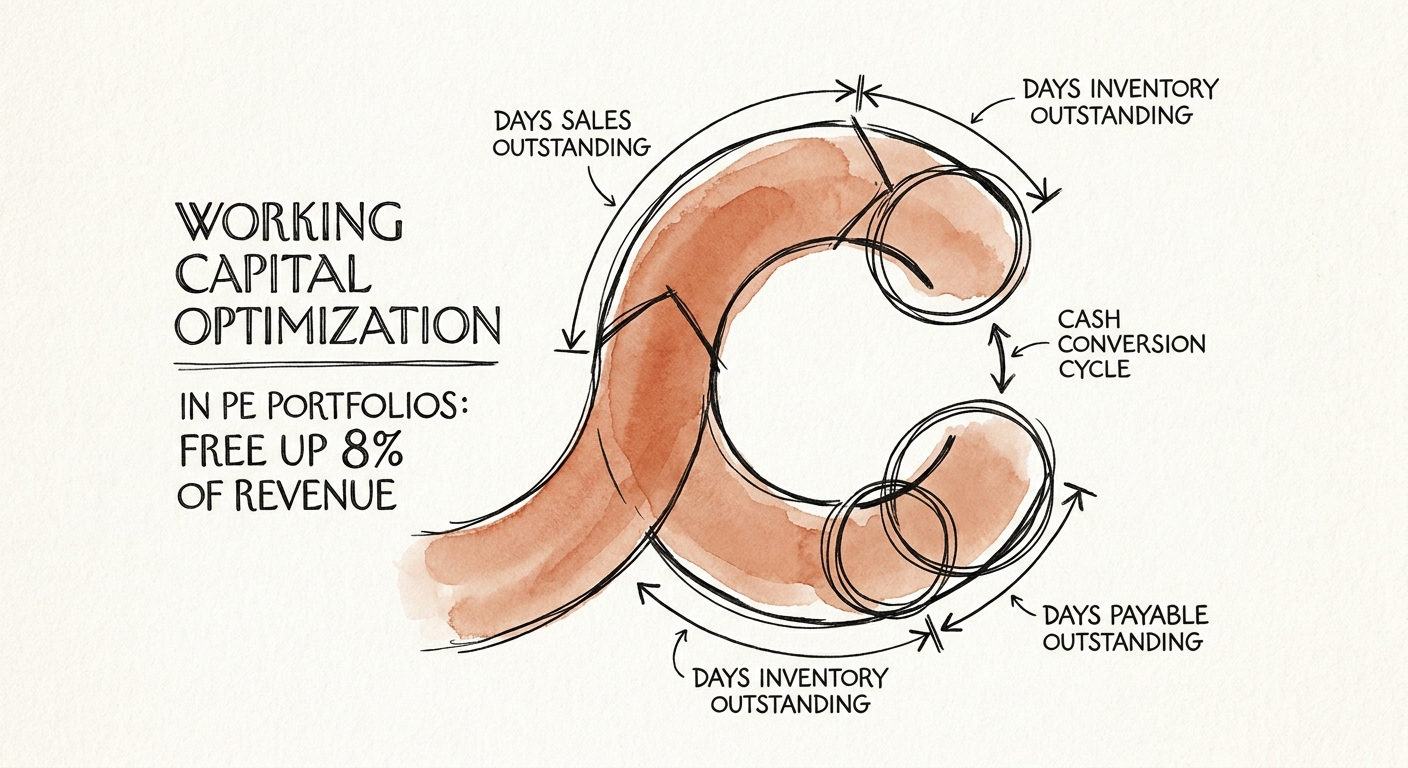
The cash conversion cycle — DSO plus DIO minus DPO — looks like an accounting figure, so the CFO owns it and everyone else ignores it. That is exactly why it stays broken. The number is actually a scorecard of how your sales org writes contracts, how your billing team invoices, and how your procurement function negotiates. A 90-day CCC is not a finance failure; it is a sales rep who waived payment terms to close a quarter, a billing system that drops invoices two weeks late, and three divisions buying the same SaaS license from three different vendors. Hackett Group benchmarking reported by CFO.com shows the largest 1,000 U.S. public companies compressed their average CCC to roughly 37 days in 2024. In the middle market we routinely open the books on a portfolio company and find 60, 75, even 90 days. That 30-to-50-day spread, multiplied by daily revenue, is the stranded cash — and it is sitting there because no single person was ever paid to chase it.
Start where the cash is closest: order-to-cash
Receivables is the fastest lever because the cash is already earned — you're just waiting on it. Tightening order-to-cash can pull AR down 10% to 30%, which on a mid-market P&L is typically 2% to 4% of revenue back in the account. But "tighten O2C" does not mean nicer reminder emails. It means enforcing the payment terms your contract already specifies instead of letting them slide as a relationship favor; it means killing the two-week lag between delivery and invoice so the clock actually starts; and it means segmenting customers by how they actually pay, not by logo size, so your collections effort goes where the days are stuck. Run a worked case: a portfolio company doing $80M with a 75-day DSO that gets to 55 frees roughly $4.4M — non-dilutive, available this quarter, no capital call. The blocker is almost never the customer. It's that nobody internally owns the day count as a hard number with their name next to it.
Payables: a scalpel, not a sledgehammer
The other side of the cycle is procure-to-pay, and this is where first-time portfolio CFOs reliably break things. The instinct is to stretch every vendor to 90 days across the board, treat DPO as free money, and book the cash flow win. Then a critical supplier pulls credit terms, a shipment stops, and you've traded a one-time cash bump for an operational fire. The timing makes it worse: Kyriba's liquidity benchmarking tracked total short-term corporate liquidity falling by roughly $565 billion year-over-year, which means your vendors are squeezed too — and a small supplier carrying your stretched terms is the one most likely to fail or fire you as a customer.
The disciplined version segments the supply base first. Harmonize payment terms where you have leverage, consolidate the fragmented vendor sprawl that three decentralized business units created, and protect the few suppliers whose failure would actually stop the business. Done with that precision, payables optimization moves AP balances 5% to 20% and typically returns 1% to 2% of revenue — and non-trade levers like prepayment cleanup and deposit recovery quietly add another 1% to 2%. Stack O2C and a clean P2P approach and you're in the 6% to 8% range without touching the income statement once.
Where this actually starts: before you own the company
The highest-leverage moment isn't the 100-day plan — it's diligence. When we run working capital diagnostics inside a quality of earnings review, the goal is to price the cycle bloat before close so it becomes a value-creation lever you've already underwritten, not a surprise. Then it gets written into the 100-day value creation plan with an owner and a target day count, the same way you'd treat a margin initiative. The best exits I've seen weren't engineered by multiple arbitrage. They were companies that learned to self-fund their own bolt-ons from liquidity they freed off their balance sheet — and a buyer pays a premium for a management team that already knows where its cash is hiding. Monday move: pick the single product line with the worst DSO, find the actual delay between delivery and invoice, and assign one name to the day count. That diagnostic alone usually reveals the first million.