The practical answer
- Short answer
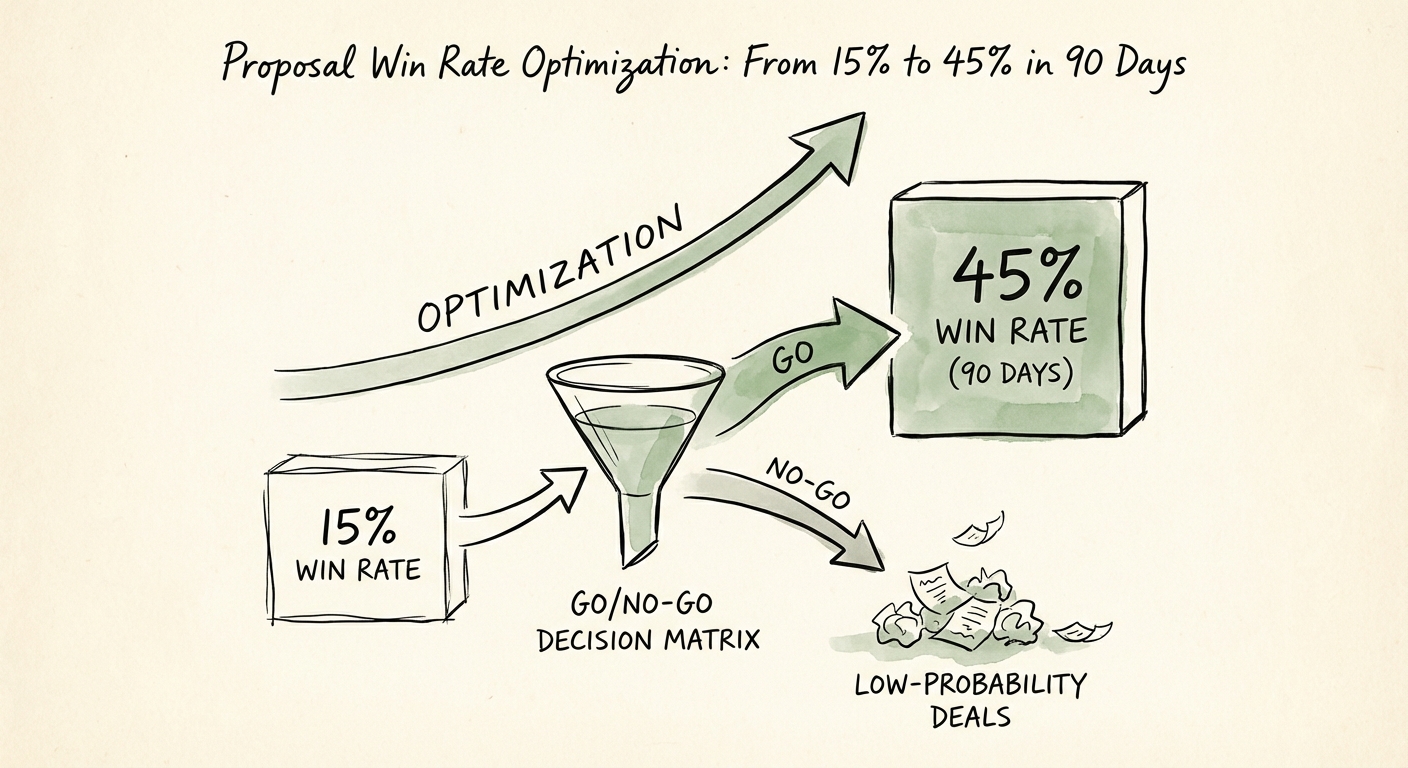
- A diagnostic guide for PE sponsors to optimize portfolio company proposal processes. Move from 15% win rates to 45% using 'Go/No-Go' logic, executive summary restructuring, and speed-to-value metrics.
- Best fit
- Industry: B2B Technology & Services. Function: Sales Operations
- Operating path
- Revenue Architecture → Commercial Performance → Office of the CFO
- Key metric
- 60% Drop in win rates for proposals sent after 24 hours compared to those sent within the first 5 hours.
The 15% Trap: Why Your Portfolio Company Is Losing 85% of Its Bids
In the high-stakes environment of Private Equity, a 15% proposal win rate is not just a sales problem; it is a capital efficiency crisis. For a portfolio company generating $50M in revenue, a 15% win rate implies that 85% of the sales engineering, solution architecture, and executive time invested in proposals is waste. This is the "Spray and Pray" trap: a volume-based approach to RFPs and proposals that prioritizes activity over accuracy.
Recent 2025 benchmarks from Optifai reveal a stark reality: Enterprise B2B SaaS win rates hover between 12% and 18% for deals over $100k. Yet, top-performing organizations—those with rigorous "Revenue Architecture"—consistently achieve win rates of 45% or higher. The delta between these two cohorts is rarely product superiority. It is process discipline.
The "Template" Failure Mode
The primary driver of the 15% win rate is the "Template Trap." In an effort to increase velocity, sales teams rely on static, feature-heavy templates that fail to address the specific commercial outcomes of the buyer. Data shows that 55% of decision-makers spend less than 15 seconds reading a proposal. If your executive summary is a generic "About Us" history lesson rather than a specific "Value Confirmation," you have lost the deal before page two.
Furthermore, the "Speed to Engagement" metric has become a disciplined filter. Proposals sent within 24 hours of a request have a 60% higher win rate than those sent after 48 hours. However, speed without customization is fatal. The bottom quartile of performers sends generic proposals quickly; the top quartile sends hyper-personalized proposals quickly, enabled by modular content libraries and rigorous qualification.
The fastest way to double your win rate is to bid on half as many deals. Rigorous qualification isn't just a sales tactic; it's a capital allocation strategy.
The Architecture of 45%: Building a Winning Proposal Function
Moving from 15% to 45% requires a fundamental restructuring of the proposal function. This is not about "writing better copy"; it is about implementing a Revenue Architecture that filters noise and amplifies signal.
1. The Disciplined "Go/No-Go" Gate
The fastest way to double your win rate is to bid on half as many deals. High-performing organizations implement a mathematically weighted "Go/No-Go" scorecard before a single slide is built. If a deal scores below 70/100 on criteria like Executive Access, Budget Confirmation, and Technical Fit, the resource allocation is denied. This shifts engineering hours from losing bids to winning bids, allowing for the depth of research required to close.
2. The Executive Summary Pivot
Your Executive Summary is the only page that matters. It must transition from a "Summary of the Proposal" to a "Business Case for Change." Structure it using the "Why Now, Why Us, Why This" framework:
- The Commercial Insight: Start with the client's problem, quantified in dollars.
- The Future State: Describe the post-implementation reality.
- The Proof: Cite one relevant case study with a verified metric.
Research indicates that proposals with this structure—specifically those that anchor ROI in the first paragraph—see conversion rates 2x higher than feature-led summaries.
3. The Video Differentiator
In 2026, text is the lowest-bandwidth form of communication. Integrating a 90-second personalized video walkthrough from the lead Solution Architect directly into the digital proposal tracks as a "significant" buying signal. Data shows that proposals with video content have an 86% higher conversion rate on landing pages and digital sales rooms. For a PE sponsor, this is a low-cost, high-leverage "quick win" to implement across the portfolio.
The 90-Day Sprint: From Diagnosis to Dominance
Optimizing proposal win rates is a quarterly objective, not a yearly one. Here is the operational roadmap for a PE Operating Partner to deploy across a portfolio company:
Month 1: Audit and Amputate
- Data Cleanse: Audit the last 12 months of CRM data. Separate "Qualified Bids" from "Flyers." Your true win rate on qualified deals is likely higher than 15%, but your resource allocation is diluted.
- Implement the Gate: Install a mandatory "Go/No-Go" meeting for all deals >$50k. If the sales rep cannot identify the Economic Buyer by name, the proposal is blocked.
- Stop the Bleeding: Ban the use of "Legacy" templates. Force all new proposals to use a simplified, outcome-based structure.
Month 2: Re-Architect and Enable
- The Content Library: Build a modular library of "verified proof points." Every claim (e.g., "we increase efficiency") must be backed by a specific metric (e.g., "we reduced cycle time by 22% for [Client X]").
- Video Enablement: Train the top 20% of sales reps on recording "Executive Intros." Equip them with tools like Loom or Vidyard.
- Pricing Presentation: Restructure pricing pages to show "Investment vs. Return" rather than "Cost per License."
Month 3: Optimize and Automate
- Tech Stack Integration: Connect the proposal software (e.g., PandaDoc, Qwilr) to the CRM. Automate the "Contract Sent" to "Contract Viewed" alert to trigger immediate follow-up.
- Feedback Loop: Institute a mandatory "Loss Review" for every deal >$100k. Categorize losses into Price, Product, or Process. If Process exceeds 20%, re-train.
By day 90, the volume of proposals may drop by 30%, but the win rate will climb toward 45%, and more importantly, the CAC Payback Period will compress as sales engineering resources are deployed more efficiently. For a PE firm, this is the definition of operational leverage.