
The practical answer
- Short answer
- A diagnostic guide for ServiceNow partners scaling from $10M to $50M. Benchmarks for bill rates, utilization, EBITDA margins, and valuation multiples.
- Best fit
- Industry: IT Services / SaaS Ecosystem. Function: Operations & Strategy
- Operating path
- Exit Readiness → Operational Excellence → Transaction Advisory Services
- Key metric
- 12x Target EBITDA valuation multiple for specialized, IP-led partners (vs. 5x for generalists).
The 'Generalist Premier' Trap
If you are reading this, you likely run a ServiceNow practice hovering between $10M and $15M in revenue. You have achieved Premier Partner status, you have a solid roster of CSAT scores above 4.5, and you are profitable. But you have stopped growing.
You have hit the "Generalist Premier" Trap. To get to $10M, you said "yes" to every ticket, every ITSM implementation, and every staff augmentation request. That was necessary for survival. But the tactics that got you to $10M are the exact anchors holding you back from $50M.
In the 2025-2026 ecosystem, ServiceNow is no longer just a ticketing system; it is the "AI Operating System" for the enterprise. The partners commanding 10x-12x EBITDA multiples are not the ones throwing bodies at tickets. They are the ones architecting Agentic AI workflows and vertical-specific solutions.
The gap between a $15M lifestyle business and a $50M strategic asset is not just headcount; it is revenue quality. Below are the specific benchmarks you need to hit to bridge that gap.
In the ServiceNow ecosystem, you don't get paid 12x EBITDA for being able to configure ITSM. You get paid 12x for knowing why a bank's compliance workflow fails and having the IP to fix it in week one.
The Economics of a $50M Practice: 2026 Benchmarks
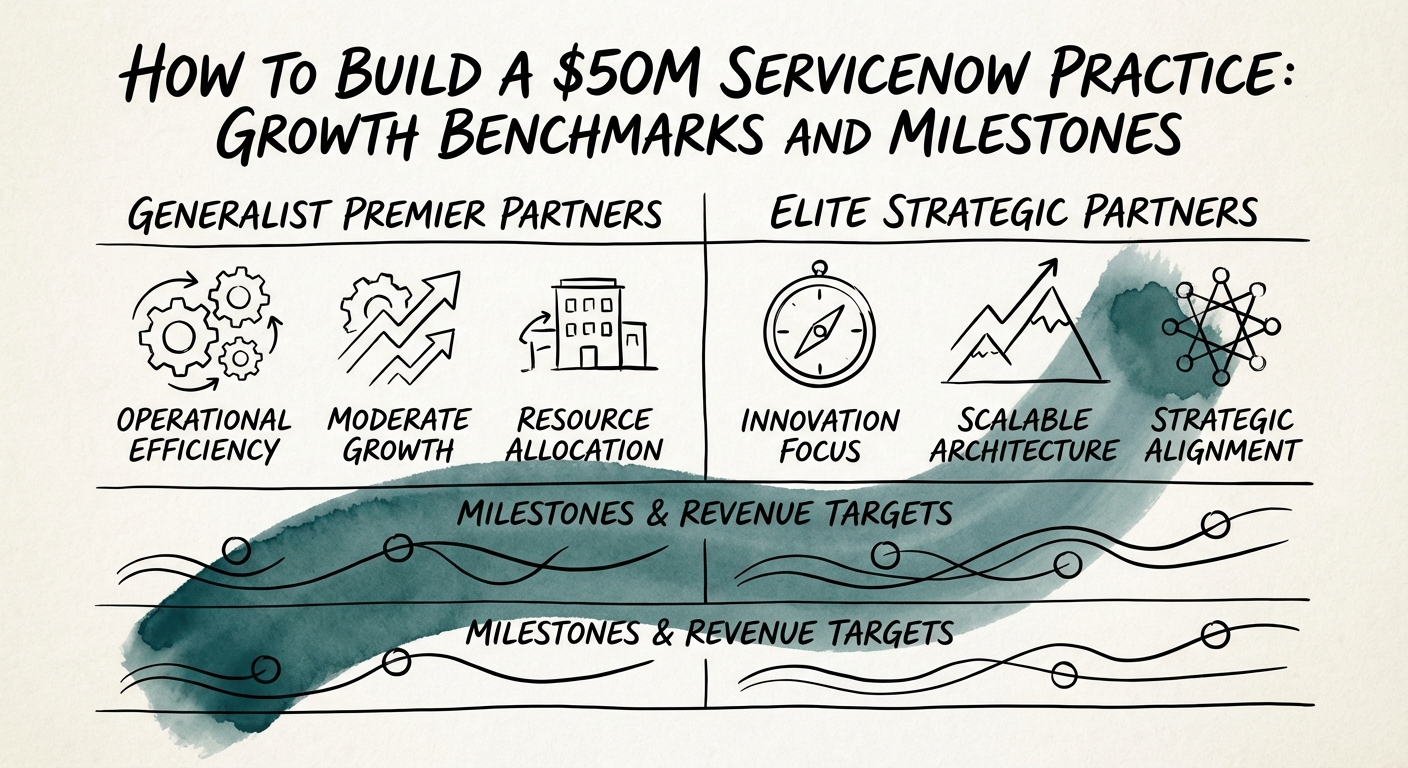
We analyzed data from top-performing Elite and Global Elite partners to establish the operational "North Star" metrics for a scalable practice. If your numbers sit in the "Generalist" column, you are building a low-margin consultancy. If they hit the "Strategic" targets, you are building a platform for exit.
| Metric | Generalist ($10M-$20M) | Strategic Asset ($30M-$50M) |
|---|---|---|
| Blended Bill Rate | $165 - $185 / hr | $225 - $285 / hr |
| Gross Margin (Services) | 35% - 40% | 48% - 55% |
| EBITDA Margin | 8% - 12% | 18% - 24% |
| Revenue Mix | 90% Project / 10% Resale | 50% Project / 30% Managed / 20% IP |
| Valuation Multiple | 4x - 6x EBITDA | 10x - 14x EBITDA |
The "3x Rule" of Implementation
Industry data confirms the "3x Rule" typically holds: for every $1 of ServiceNow licensing sold, the client spends $3-$5 on implementation and transformation services. However, where that spend goes has shifted. In 2022, it went to basic configuration. In 2026, it flows to Generative AI (Now Assist) integration and industry-specific workflows (e.g., Financial Services Operations).
Utilization vs. Realization
The most dangerous metric for a scaling partner is raw utilization. A $10M firm celebrates 85% utilization. A $50M firm scrutinizes Realized Rate per Hour. If your team is 90% utilized but billing $150/hr on a fixed-bid project that went sideways, you are bleeding capacity. Top-tier practices target 72-75% utilization but maintain strict governance on change orders to protect a $250/hr realized effective rate.
The Playbook: Three Phases to $50M
Phase 1: Disciplined Verticalization ($10M → $20M)
Stop being a "ServiceNow Shop." Become the "Healthcare Clinical Operations Expert on ServiceNow." Generalist partners compete on rate. Vertical partners compete on IP and outcome. Pick two verticals (e.g., HCLS, Finserv, Manufacturing) where you have referenceable case studies and only hire architects with domain expertise in those fields.
Phase 2: The "Asset" Turn ($20M → $35M)
To break the linear relationship between revenue and headcount, you must productize. This doesn't mean becoming an ISV overnight. It means building Accelerators—pre-packaged code sets, scope configurations, and documentation for your specific vertical. When you can deliver a project in 400 hours that takes your competitor 800 hours, you have two choices: charge half (don't do this) or double your margin (do this).
Phase 3: The Talent "Barbell" ($35M → $50M)
The staff augmentation trap kills valuation. Shift your org design to a "Barbell" model:
- Top End: Expensive, elite Solution Architects ($200k+ salaries) who drive strategy and solve complex business problems.
- Bottom End: A scalable academy model or nearshore delivery center for configuration and testing.
- Middle: Eliminate the "mid-level order taker" who adds overhead but not strategic value.
By $50M, your valuation is no longer driven by your revenue, but by your Quality of Earnings. Buyers pay for predictability, IP, and high retention—not just a roster of certified bodies.