The practical answer
- Short answer
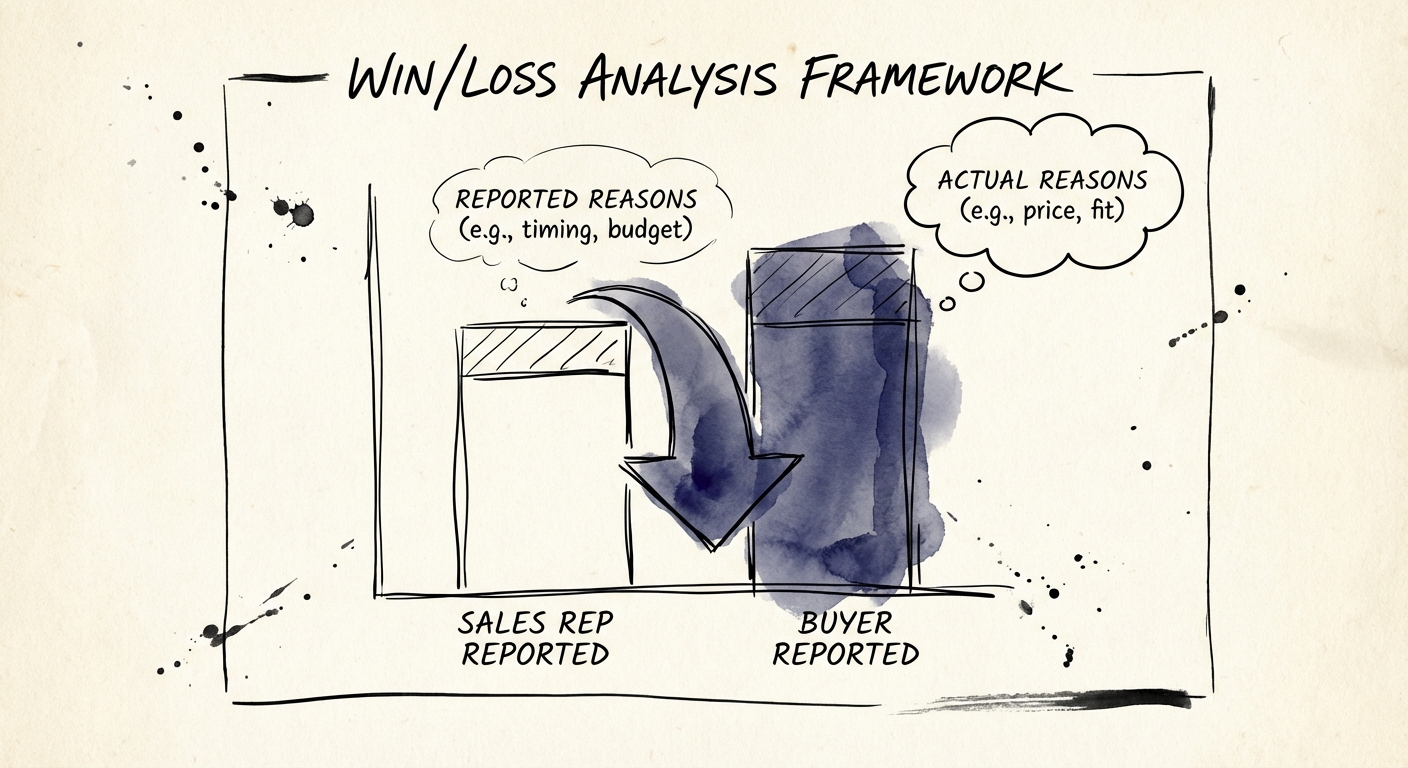
- Stop relying on CRM checkboxes. A diagnostic framework for win/loss analysis that uncovers the 70% of deal insights your sales team is missing.
- Best fit
- Industry: Private Equity. Function: Sales Operations
- Operating path
- GTM Execution → Commercial Performance → Performance Improvement
- Key metric
- 50% Improvement in Win Rates for organizations with rigorous Win/Loss programs (Gartner)
The CRM Hallucination: Why Your "Closed Lost" Data Is Worthless
If you pull a report from Salesforce right now, I can predict with 90% accuracy what your top reason for lost deals is: Price.
It is the safe harbor for every sales representative. Checking "Price" absolves them of blame. It suggests the product was too expensive or the market is commoditized. It tells you, the executive, that the failure was external, not operational. It is also, statistically speaking, a lie.
Recent data from Corporate Visions and Clozd indicates a significant 50-70% discrepancy between why sales reps say they lost a deal and why buyers say they chose a competitor. When third parties interview those same lost prospects, "Price" rarely remains the primary driver. Instead, the real reasons emerge: a lack of trust in the implementation timeline, a failure to demonstrate specific value, or a misalignment with key stakeholders.
The "Validation Gap"
We call this the Validation Gap. It is the distance between your CRM data and market reality. For Private Equity sponsors and CEOs, this gap is a valuation killer. You are making product roadmap decisions, pricing adjustments, and hiring forecasts based on fiction. You might lower prices to fix a "Price" problem, only to find that your win rates don't move because the actual issue was your inability to map technical features to business outcomes.
Real competitive intelligence doesn't come from a dropdown menu in HubSpot. It comes from a rigorous, forensic analysis of the deals you didn't close. Without this, your pipeline coverage is just a vanity metric.
Your CRM can become an archive of convenient 'Price' excuses. Real competitive intelligence doesn't come from a dropdown menu; it comes from the uncomfortable truth of why you actually lost.
The 5-Point Win/Loss Diagnostic Framework
To close the Validation Gap, you need a forensic approach to win/loss analysis. This is not a survey sent by marketing; it is a diagnostic capability that sits at the intersection of Sales, Product, and Customer Success.
1. The Third-Party Mandate
Never let the sales team conduct their own autopsies. The bias is insurmountable. Buyers are also conditioned to be polite to the people they just rejected. They will tell your rep, "It was budget," but they will tell a neutral third party, "The rep didn't understand our industry." Use an external partner or a neutral internal operator (like a Product Marketer or Chief of Staff) who has no commission tied to the deal.
2. The 48-Hour Autopsy vs. The 30-Day Deep Dive
Speed matters, but depth matters more. Implement a "48-Hour Autopsy" for every late-stage loss (Stage 4+), requiring the rep to document the narrative of the loss, not just the checkbox. Then, target 20% of these for the "30-Day Deep Dive" interview. Waiting 2-4 weeks allows the emotion of the deal to settle, often yielding more candid feedback from the buyer.
3. The "No Decision" Cohort
Most companies ignore deals lost to "No Decision." This is a mistake. "No Decision" is usually a failure of Sales Execution, not Product. It means you failed to build a business case strong enough to overcome inertia. Treat "No Decision" as a competitor. If this cohort exceeds 25% of your losses, your problem isn't the market; it's your value selling methodology.
4. The Question Stack
Stop asking about features. Ask about decision drivers. Your interview script should focus on:
- Trigger Events: "What specific problem caused you to look for a solution now?"
- Decision Criteria: "Rank these three factors: Price, Speed to Value, Risk."
- The "Aha" Moment (or Lack Thereof): "Was there a specific moment where we lost your confidence?"
5. Quantitative Coding
Qualitative interviews must be converted into quantitative data. Create a tagging taxonomy for loss reasons: Product Gap (Critical), Product Gap (Nice to Have), Sales Process (Responsiveness), Sales Process (Technical Knowledge). This allows you to spot trends. If 40% of losses are tagged Sales Process (Technical Knowledge), you don't need a new feature; you need a Sales Engineer.
Turning Autopsies into Revenue: The Pivot
Data without action is overhead. A rigorous Win/Loss framework should directly influence your product roadmap and GTM strategy. Here is how to map the findings to execution:
The "Price" Pivot
If unbiased data confirms you are losing on price and your win rate is below 20%, you have a pricing model problem. However, if you are losing on price but your win rate is healthy (30%+), you likely have a segmentation problem. You are pitching premium value to commodity buyers. The fix isn't to lower the price; it's to disqualify those leads earlier.
The "Product" Pivot
When buyers cite "Missing Features," dig deeper. Is the feature actually missing, or did the rep fail to demo it? Our benchmarks show that 30% of "Missing Feature" losses are actually "Demo Failures." The feature exists, but the prospect didn't see it. This is a Sales Enablement fix, not an Engineering one. Save your R&D budget for true gaps.
The Executive Dashboard
For the Board and PE sponsors, summarize Win/Loss data into a quarterly "red/green" analysis. Show the top three true reasons for churn and loss, and map them to specific initiatives. This transforms "We missed the quarter" into "We identified a 15% leak in technical validation and have implemented a new SE certification program to fix it." That is the difference between a struggling Portfolio Company and a disciplined platform asset.