The practical answer
- Short answer
- A diagnostic guide for PE sponsors and founders on Zendesk partner program economics. Analysis of margins, tier requirements, and the valuation gap between resellers and CX consultancies.
- Best fit
- Industry: B2B Technology. Function: Partner Ecosystem
- Operating path
- Unit Economics → Commercial Performance → Transaction Advisory Services
- Key metric
- 10-20% Typical referral fee for Affiliate partners, often yielding higher net margins than low-volume resale models.
The 'Premier' Vanity Trap: When Status Eats Strategy
For many IT services firms, climbing the Zendesk partner ladder from Affiliate to Select to Premier/Master is viewed as the default path to growth. The logic seems sound: higher tiers unlock higher resale margins (typically jumping from a 10% referral fee to 20-30% resale discounts), dedicated partner management, and lead distribution. However, for Private Equity sponsors and founders analyzing unit economics, this ascent often represents a "margin trap."
The cost of maintaining Premier status in 2026 has effectively doubled. Between the requirements for certified individuals (across Sales, Support, and Implementation tracks) and the Minimum Revenue Commitments (ACV thresholds), the Cost of Compliance often outpaces the incremental margin gained from resale. Our data suggests that for partners with under $5M in Zendesk-attributed revenue, the net margin on a "Premier" practice is often lower than that of a "Select" partner due to the specialized headcount required to maintain the badge.
The economic reality is that Zendesk—like Salesforce and ServiceNow—has commoditized the lower end of the stack. If your business model relies on the arbitrage between the wholesale license cost and the retail price (plus basic setup fees), you are competing in a "Race to Zero." The partners commanding premium valuations are not the ones moving the most licenses; they are the ones bypassing the resale game entirely to focus on high-complexity transformation.
The partners commanding premium valuations are not the ones moving the most licenses; they are the ones bypassing the resale game entirely to focus on high-complexity transformation.
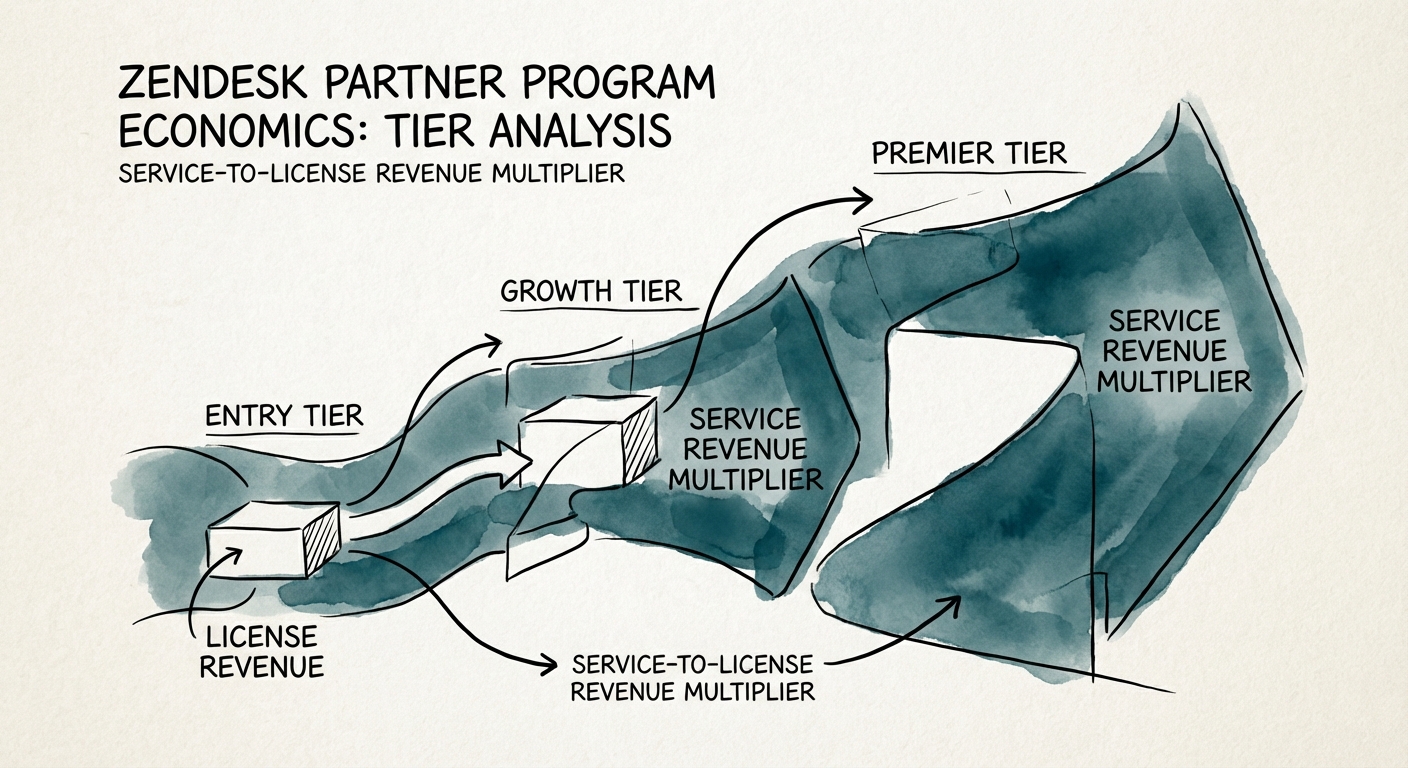
The Service Multiplier: Ticket Flippers vs. CX Architects
The bifurcation in the Zendesk partner ecosystem is stark. On one side, you have "Ticket Flippers"—firms that set up queues, triggers, and macros. These firms typically see a Service-to-License revenue ratio of 1:1. For every dollar of Annual Recurring Revenue (ARR) they sell for Zendesk, they bill one dollar in one-time implementation fees. This model is difficult to scale and creates lumpy cash flow.
On the other side are the "CX Architects." These firms have pivoted their specific expertise to Zendesk Sunshine, custom app development, and AI agent orchestration. By integrating Zendesk with backend ERPs, building custom middleware, and deploying advanced AI workflows, these partners achieve a Service-to-License ratio of 4.5:1.
This multiplier is where the enterprise value lives. A "Premier" partner focused on resale might show top-line growth, but their gross margins on services often hover around 35-40% due to the high cost of sales. In contrast, a boutique CX consultancy (even at a lower partner tier) focusing on high-end integrations frequently commands 65%+ gross margins on services. The strategic pivot for 2026 is to treat Zendesk not as a help desk tool to be installed, but as a headless CRM platform to be developed against.
The Private Equity View: Valuation Implications
When we evaluate Zendesk partners for acquisition, the partner tier is often a vanity metric that disguises underlying risk. A "Premier" partner heavily dependent on resale revenue (where 40%+ of gross profit comes from license margin) typically trades at a multiple of 0.8x to 1.5x Revenue. The risk profile is too high; Zendesk can change program terms, cut margins, or take accounts direct at any moment.
Conversely, partners with a "Solution-First" DNA—those with proprietary IP (e.g., industry-specific Sunshine connectors) and high service multipliers—are trading at 8x to 12x EBITDA. These firms own the workflow, not just the license transaction.
The Pivot for 2026
If you are a Zendesk partner looking to exit, stop chasing tier advancement for the sake of a slightly higher resale margin. Instead, audit your revenue mix. If your services revenue is less than 3x your license ARR, you are likely leaving valuation on the table. Shift your engineering talent toward AI Agents and Custom Objects (the 2026 growth vectors) to move up the value chain.