
The practical answer
- Short answer
- Most 13-week cash models miss by 18.4% by week eight. The fix isn't a bigger spreadsheet — it's pricing every receivable by the customer who owes it.
- Best fit
- Industry: B2B Technology. Function: Office of the CFO
- Operating path
- Financial Infrastructure → Commercial Performance → Valuations
- Key metric
- 41% Of PE portfolio covenant breaches stem directly from intra-quarter cash flow forecast failures.
Picture a controller at a PE-owned software company presenting her 13-week cash flow model to the board on a Monday. Week one looks clean. By Thursday, a single enterprise customer's payment hasn't cleared — it's stuck in their procurement portal behind a dispute over a half-percent SLA credit — and that one receivable is the difference between funding payroll from cash and tapping the revolver. The model wasn't wrong about the math. It was wrong about the world. It assumed a Net 30 invoice pays on day 30, and the customer assumed it pays whenever their AP analyst gets around to approving line 14.
This is the quiet failure mode of the rolling 13-week model: it degrades fastest in exactly the window operating partners trust most. PwC's 2025 Global Working Capital Study puts the average mid-market drift at 18.4% by week eight — meaning the back half of every quarter you forecast is essentially fiction wearing a confidence interval. And the people building these models are not careless. Gartner's 2026 FP&A Technology Benchmark found 73% of mid-market finance teams still roll the forecast forward by hand in a single spreadsheet, which means the file is stale the instant it's saved and someone is burning a full day a week keeping a stale file looking current.
The tell is always the same. The model treats the outbound side and the inbound side as if they obey the same physics. They don't. Your treasury position on the payables side is a fact — you control the wire. The position on the receivables side is a hope someone formatted as a number.
A 13-week forecast that's deterministic on the receivable side isn't a forecast. It's a wish with a column header. Price every inflow by the customer who actually owes it, or stop calling it a model.
Your payables are a fact. Your receivables are a rumor.
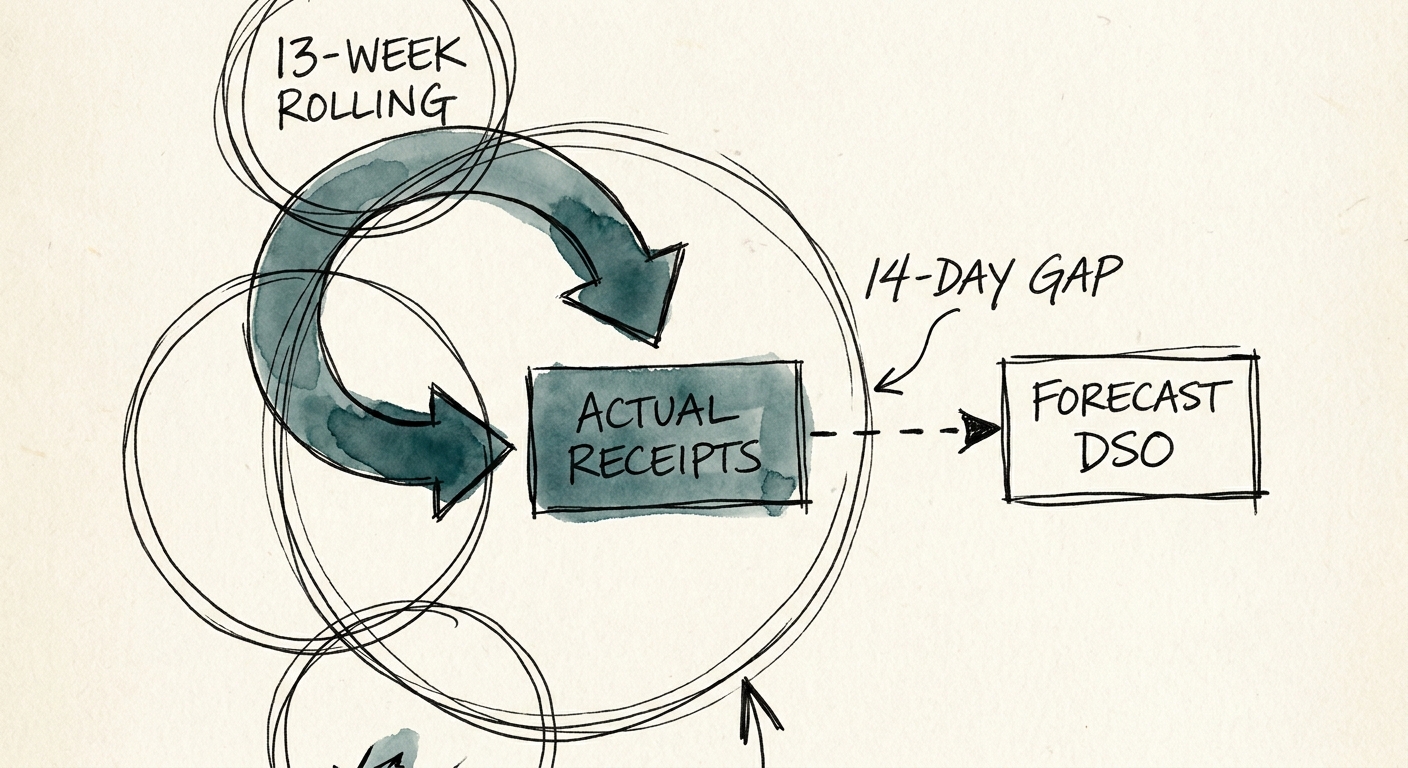
Here is the asymmetry that breaks the rolling model, and why a bigger revolver never fixes it. When you forecast cash out, you're scheduling events you control: the payroll run, the AWS bill, the debt service, the vendor wire you choose to send Tuesday instead of Friday. That side of the model is close to deterministic. When you forecast cash in, you're predicting the internal behavior of every customer's accounts-payable function — approval queues, dispute holds, the CFO who batches all wires on the 25th regardless of your terms. The Hackett Group's 2025 U.S. Working Capital Survey measured a 14-day gap between forecasted and actual DSO for enterprise software vendors. Fourteen days of float you assumed you had and didn't. In a quarter, that's enough to erase a buffer that looked comfortable in the deck.
The reason this matters more in a PE-owned tech company than anywhere else: the consequence isn't an awkward variance line, it's a covenant test. Bain & Company's 2026 Global Private Equity Report attributes 41% of recent portfolio-company covenant breaches to intra-quarter cash forecasting failures rather than actual profitability problems. Read that again. Four in ten breaches are healthy businesses that simply couldn't see their own cash. The board was told the money was there because the 13-week model said so, while the money sat in a portal behind a fight over half a percent.
So the question isn't "how do we hold more cash." It's "why is a hope sitting in the inflow column with the same formatting as a fact." You close that gap with disciplined working capital optimization — by making your billing operation feed your treasury function instead of running parallel to it. Every receivable that lives in the forecast instead of the bank is dragging IRR and quietly increasing the odds of a capital call nobody wants to make.
Price every inflow by the customer who owes it
The fix is not more model. It's a different unit of measure. Stop forecasting receivables by invoice term and start forecasting them by payer. Every open invoice gets a probability and an expected-clear date derived from that specific customer's trailing six-month payment behavior — not the Net 30 on the PDF. The customer who has paid you on day 52 for the last four invoices does not belong in your week-five inflow no matter what the contract says. Once you weight inflows this way, the back half of the 13 weeks stops being decorative and starts being defensible.
Mechanically, that means wiring your billing system, CRM, and bank feeds into one closed loop so daily cleared cash reconciles against open invoices automatically — and the gap between what sales booked and what treasury actually collected shows up the morning it happens, not at quarter-end. Deloitte's 2026 Global Corporate Treasury Survey found teams that moved to API-driven, probability-weighted AR modeling pulled week-13 variance down to 4.2%. The same move surfaces a problem most boards never name out loud: the difference between bookings and collections, which is the heart of the ARR-to-cash timing gap that makes a "growing" SaaS company run out of money.
What you can do Monday, before any of that integration exists: pull your last two quarters of paid invoices, sort by customer, and compute actual average days-to-clear per payer. Then re-run week one of your current 13-week model using those real numbers instead of contract terms. If week one moves more than five percent, stop trusting weeks two through 13 entirely — because a five-percent error in week one compounds into a catastrophe by the back of the quarter. That single re-run is usually the moment a finance team realizes their forecast was never a forecast. It was an invoice ledger with optimistic dates.