
The practical answer
- Short answer
- Stop chasing empty revenue. Why AWS resale margins (<10%) are killing your valuation, and how to capture the $7.13 services multiplier instead.
- Best fit
- Industry: Cloud Consulting (AWS Ecosystem). Function: Finance & Strategy
- Operating path
- Unit Economics → Commercial Performance → Transaction Advisory Services
- Key metric
- $7.13 Services revenue potential for every $1 of AWS sold by 'Expert' partners (Canalys 2025).
The "Empty Calorie" Revenue Problem
If you are celebrating a 30% year-over-year growth rate because your AWS resale bookings jumped, stop. You are likely digging a valuation hole that will be impossible to climb out of during due diligence.
For founders of cloud consultancies ($10M–$50M range), top-line revenue is a vanity metric. I see this constantly in CIMs (Confidential Information Memorandums): a firm claims $25M in revenue, but upon peeling back the P&L, $12M of that is low-margin AWS resale (pass-through infrastructure spend) and only $13M is actual value-add services.
Here is the brutal reality of the market in 2026: Resale revenue trades at 0.5x to 0.8x. Professional Services revenue trades at 1.8x to 2.5x. IP/Managed Services revenue trades at 12x+.
When you blend these together into a single "Revenue" line item, you aren't boosting your valuation; you are diluting your high-quality services revenue with low-quality resale sludge. PE buyers will immediately strip out the resale revenue to calculate your "Net Revenue" and apply a lower multiple to the remaining services because your blended gross margins look terrible (often dragged down to the 25-30% range).
The Hierarchy of AWS Partner Value
According to the 2025 Canalys AWS Partner Ecosystem study, the gap between "Focused" partners (resale-heavy) and "Expert" partners (services-heavy) has widened to an abyss.
- Focused Partners (Resellers): Generate $1.26 in total value for every $1 of AWS sold. Margins are razor-thin (<10%).
- Expert Partners (Services/IP): Generate $7.13 in total value for every $1 of AWS sold. Margins are healthy (40-60%).
If you are a founder stuck at $20M revenue, it is likely because you are operating as a "Focused" partner while trying to sell yourself as an "Expert" one. The market knows the difference.
Resale is the 'empty calorie' of the IT services world. It fills up the top line, but it starves the valuation.
The Economics of the Pivot: CPPO and the "Service-Led" Model
You cannot abandon resale entirely—it remains a critical wedge for owning the customer relationship. However, you must change how you book it and what you wrap around it.
1. The CPPO Bridge
The traditional resale model (buying reserved instances, arbitraging the spread) is a dying game for anyone under $100M in GMV. The margin compression is relentless. The smart play for 2026 is the Channel Partner Private Offer (CPPO) mechanism on the AWS Marketplace.
Instead of low-margin infrastructure resale, CPPO allows you to transact high-margin ISV software (DataDog, Snowflake, CrowdStrike) and wrap your professional services into the transaction. This shifts your revenue mix from "Infrastructure Pass-Through" to "Solution Value." Market data shows that partners leveraging Marketplace have 40% larger deal sizes and significantly faster sales cycles.
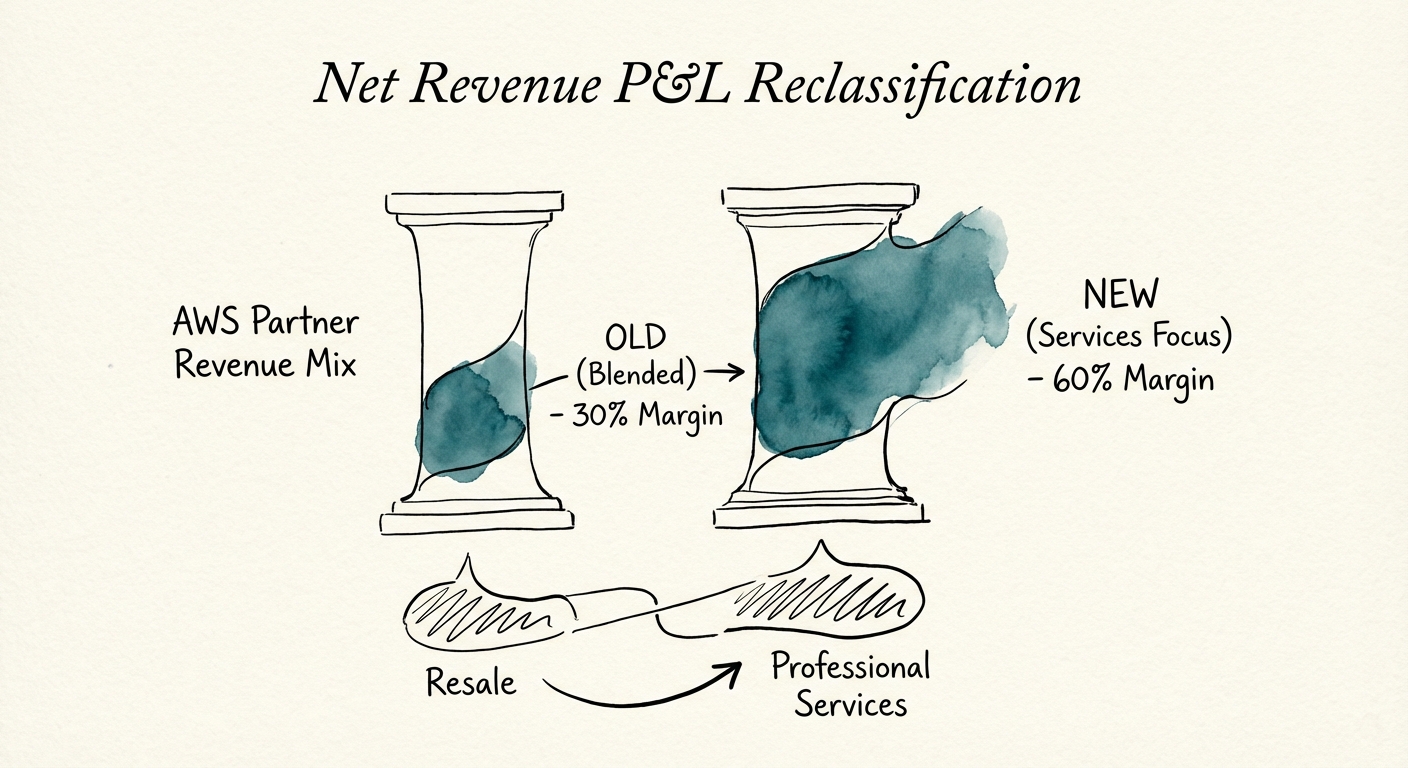
2. Segregating Your P&L (The "Net Revenue" Fix)
Do not wait for a buyer to normalize your P&L. Do it today.
Bad Reporting:
Revenue: $20M (Blended)
COGS: $14M
Gross Margin: $6M (30%)
Result: You look like a low-margin commodity shop.
Exit-Ready Reporting:
Gross Revenue: $20M
Less: Pass-Through Hardware/Software: ($10M)
Net Revenue: $10M
COGS (Services Only): $4M
Net Gross Margin: $6M (60%)
Result: You look like a premium boutique consultancy with elite margins.
This simple reclassification forces you to manage the business based on Net Revenue, which is the only number a PE firm cares about. If your Net Revenue isn't growing at 20%+, your resale growth is irrelevant.
Benchmarks: What "Good" Looks Like in 2026
To maximize your exit multiple, your revenue composition must align with the "Expert" partner profile. Here are the benchmarks you should be tracking quarterly:
- Resale / Services Mix: Target a maximum of 20% Gross Profit contribution from resale. If resale profit exceeds 20%, you are becoming a bank, not a consultancy.
- Services Gross Margin: Must be 45%+. If you are below 40%, your delivery model is broken (likely too much senior talent doing junior work, or scope creep).
- Managed Services Attach Rate: 30% of your projects should convert to recurring Managed Services contracts. This is where the valuation multiplier lives.
The "Year 2" Reality
Canalys data indicates that 61% of the partner multiplier is realized after the first year. The "Resale Trap" focuses on the transaction (Day 1). The "Services Premium" focuses on the lifecycle (Year 2+).
If your customer success team is incentivized solely on renewals (keeping the resale lights on) rather than expansion (selling the Year 2 modernization project), you are leaving the $7.13 multiplier on the table. Shift your incentive plans immediately. Pay your account managers on Net Services Revenue growth, not total contract value.
The Verdict: You can be a reseller, or you can be a high-value partner. But you cannot be both and expect a premium valuation. Pick a lane, and if you choose "Partner," treat resale as a lead magnet, not a revenue pillar.