
The practical answer
- Short answer
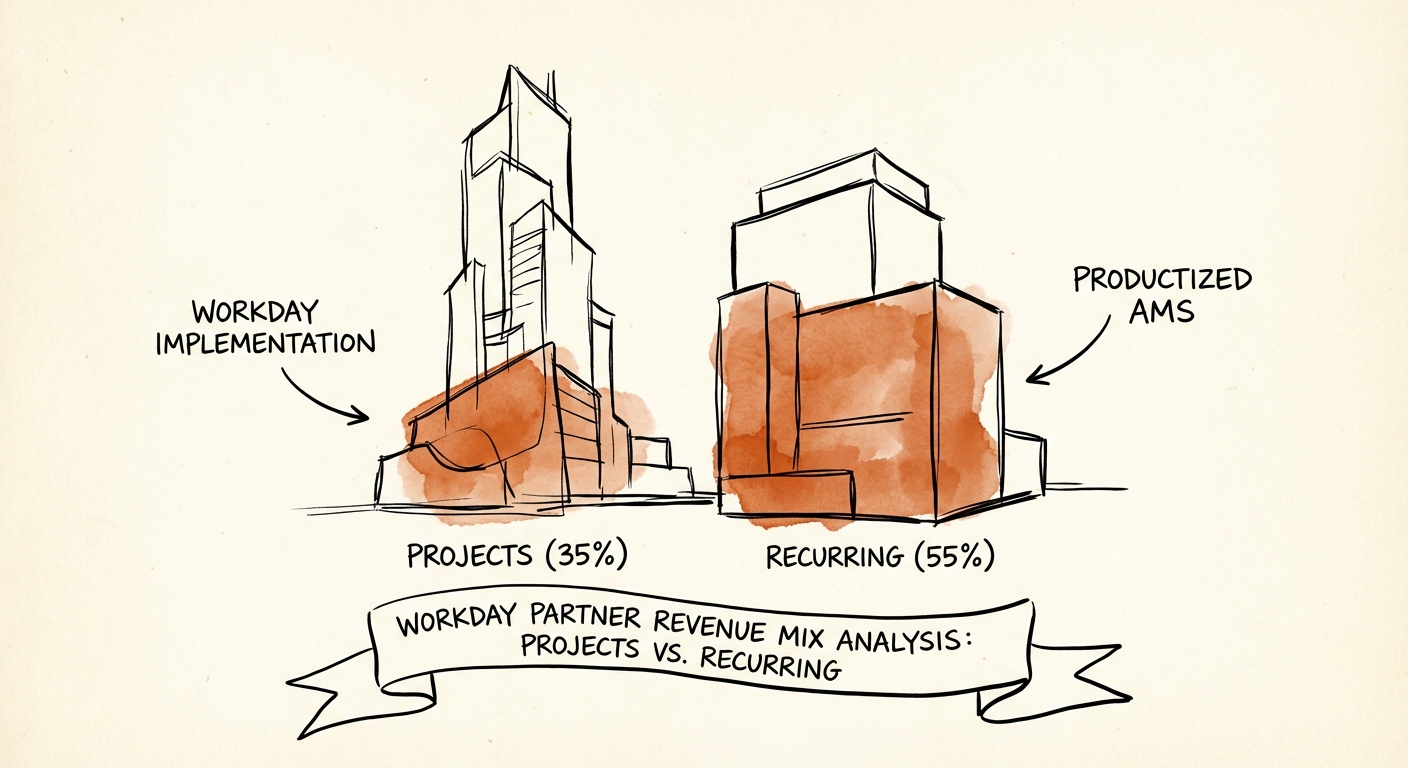
- Why Workday partners with >80% project revenue hit a valuation ceiling. Benchmarks for AMS revenue mix, margins, and the valuation gap between implementation shops and strategic advisors.
- Best fit
- Industry: Enterprise Software / Professional Services. Function: Revenue Architecture
- Operating path
- Unit Economics → Commercial Performance → Transaction Advisory Services
- Key metric
- 1.2x Average revenue multiple for Workday partners with >80% project concentration.
The January 1st Panic: The Reality of the Project Hamster Wheel
It is January 15th. If you run a Workday practice with less than 15% recurring revenue, you are currently staring at a pipeline that needs to replace 85% of last year's revenue just to stay flat. You are not building a business; you are running a very expensive hamster wheel.
We call this the Project Revenue Trap. In the Workday ecosystem, the allure of the "big bang" implementation is inhigh-riskating. A single Phase 1 deployment for a mid-market client can range from $500k to $2M. It looks great on the P&L in Q2. But by Q4, that revenue is gone, and you are back to responding to RFPs, fighting for rates against the Big 4, and praying your utilization doesn't dip below 68%.
The Valuation Gap: 1.2x vs. 2.5x
Here is the hard truth about your exit. Private equity buyers do not pay premium multiples for project revenue. They treat it as "one-time" cash flow.
In 2025, we analyzed the valuation spread for Workday partners based on their revenue mix:
- The Implementation Shop (90% Projects / 10% AMS): Trades at 1.0x - 1.3x Revenue (approx. 5x-6x EBITDA). The buyer sees risk. If the sales team has a bad quarter, the business collapses.
- The Strategic Partner (60% Projects / 40% Recurring): Trades at 2.0x - 2.8x Revenue (approx. 10x-12x EBITDA). The buyer sees a platform. They are buying the customer base, not just the delivery capacity.
If you are doing $20M in revenue, this mix difference is the mathematical difference between a $24M exit and a $50M exit. You are doing the same amount of work, but your Revenue Architecture is destroying $26M of shareholder value.
You are doing the same amount of work, but your revenue architecture is destroying $26M of shareholder value. The difference between a 1.2x and a 2.5x exit isn't size—it's mix.
The AMS Pivot: From "Support Tickets" to "Optimization as a Service"
The most common objection I hear from founders is: "We tried AMS (Application Management Services). It killed our margins. Nobody wants to pay $200/hour for password resets."
If you think AMS is a help desk, you have already lost. In the Workday ecosystem, "Help Desk" is a commodity race to the bottom, competing with offshore firms charging $65/hour. You cannot win that game.
The partners commanding 40% margins on recurring revenue are not selling support; they are selling Optimization as a Service. They capitalize on the specific cadence of the Workday product itself.
The "Release Management" Wedge
Workday pushes two major updates per year (R1 and R2). This is not optional for customers. It creates a recurring event of technical debt and feature opportunity.
Your recurring contract shouldn't be a bucket of hours. It should be a subscription that covers:
- Release Impact Analysis: "Here is what breaks in R1, and here is what you need to test."
- Regression Testing as a Service: Automated testing scripts (using tools like Kainos Smart or proprietary IP) to validate core business processes.
- New Feature Adoption: "You are paying for these new modules in your subscription—let us turn them on for you."
By productizing this cycle, you move from "reactive support" (low value) to "proactive governance" (strategic value). You shift the conversation from "Why did this take 2 hours?" to "How do we leverage the new AI features in the 2026 release?"
The Margin Math
A pure implementation typically runs at 35-40% Gross Margin due to the high cost of senior architects and travel. A mature, productized AMS practice—leveraging a mix of senior onshore advisors and offshore execution—should run at 50-60% Gross Margin. This blend creates the "Rule of 40" profile that PE firms aggressively hunt.
The 3-Step Action Plan to Fix Your Revenue Mix
You cannot simply "wish" for recurring revenue. You have to engineer it into your sales motion. Here is the playbook we use to restructure Workday partners:
1. The "Forever Contract" (Bundle AMS at Point of Sale)
Stop selling implementations. Start
selling "Lifecycle Partnerships." Your proposals should include
Phase 1 (Implementation) AND Phase 2 (Optimization) as a single contract.
The
Rule: Sales reps do not get full commission on the implementation unless
they attach a minimum 12-month managed services contract. If they sell the implementation
naked, their commission is cut by 50%. Watch how fast your AMS attach rate jumps
from 15% to 80%.
2. Mining the "Orphan" Base
There are thousands of
Workday customers who are unhappy with their original implementation partner or
the generic support from large GSI firms. These are "Orphans."
Launch a
specific sales motion targeting live customers with a "Tenant Health Check." This
is a fixed-fee diagnostic ($15k-$25k) that audits their configuration against best
practices. The deliverable is a roadmap of fixes. The execution of that
roadmap is your 12-month AMS contract.
3. Build "Micro-IP" with Workday Extend
The
highest valuation multiple comes from Intellectual Property. You don't need to build
a whole new ERP. Use Workday Extend to build small, specific apps
for your vertical (e.g., "Nurse Scheduling for Regional Hospitals" or "Union Compliance
Reporting for Manufacturing").
Even $1M of high-margin SaaS revenue attached
to your services business validates the "Tech-Enabled" narrative and can expand
your multiple by a full turn.