The practical answer
- Short answer
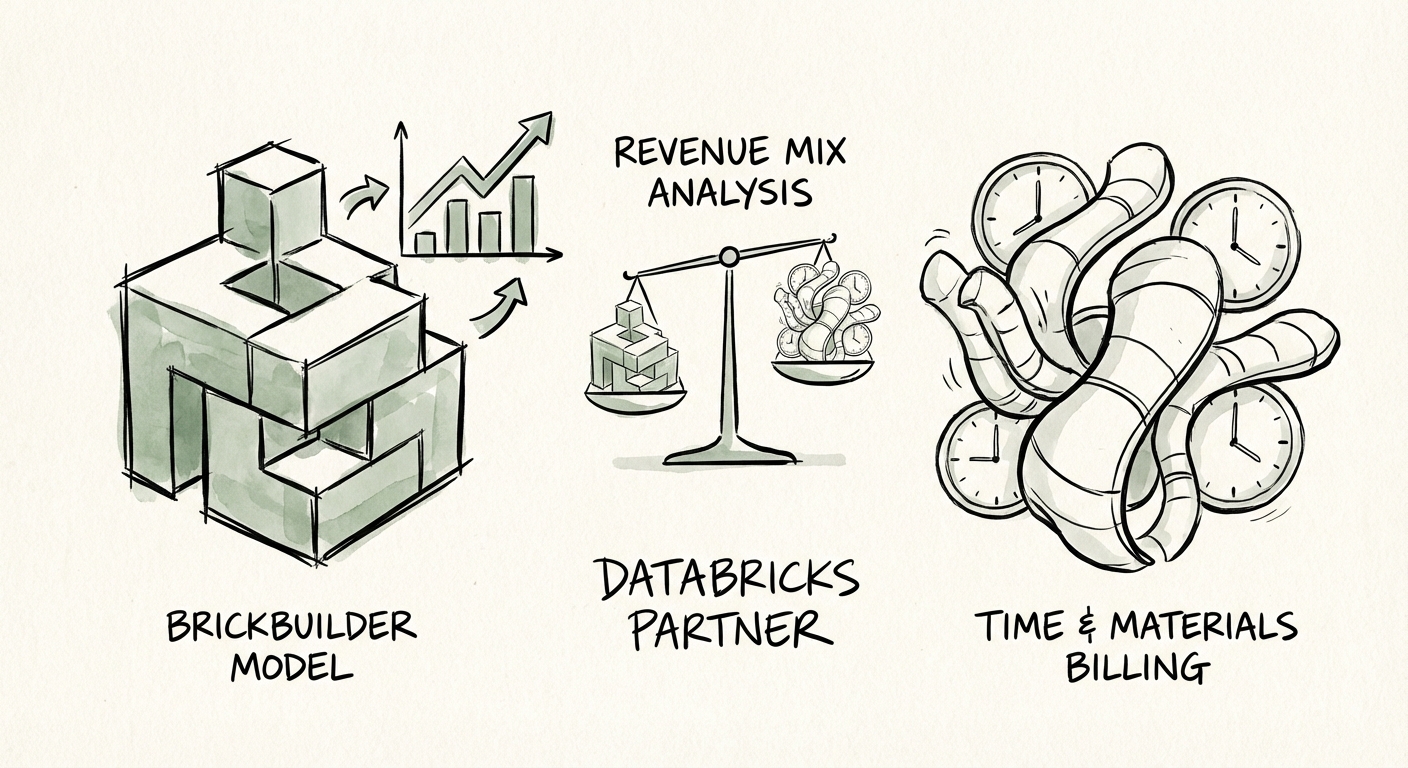
- Two Databricks partners, same $30M revenue. One sells at 6x EBITDA, the other at 14x. The difference is hiding in four line items on your P&L.
- Best fit
- Industry: Data & AI. Function: Revenue Operations
- Operating path
- Unit Economics → Commercial Performance → Transaction Advisory Services
- Key metric
- 57% Databricks YoY revenue growth (reaching ~$4.8B run rate), signaling massive ecosystem demand.
Two partners walked into a data room. Same revenue. Half the price.
Picture two Databricks consulting shops sitting across from the same private equity buyer. Both did $30M last year. Both have the certifications, the partner-tier badge, the LinkedIn posts about being "the fastest-growing partner in the region." Then the buyer opens the data room, and the offers come back $80M apart.
The first firm gets an indication around 6x EBITDA. The second clears 14x. Neither founder saw it coming, because they'd been measuring the wrong thing for years. They watched top-line growth ride the Databricks wave — the platform is now past a $4.8 billion revenue run rate, growing north of 57% year-over-year — and assumed a rising tide was lifting their enterprise value too. It wasn't. It was lifting their headcount.
Here is the uncomfortable truth a diligence team finds in about ninety minutes: a Databricks partner's multiple is not set by how much Databricks work you do. It's set by what happens to that revenue the instant a project ends. If a 14-engineer PySpark migration wraps and 14 engineers go on the bench waiting for the next statement of work, you don't have recurring revenue — you have a project pipeline you have to re-win every quarter. Buyers price that risk brutally, and they're right to.
The whole game, then, is reading your own P&L the way an acquirer reads it. Not "how big is the number" but "how durable is the dollar." Let me show you exactly where they look.
A buyer doesn't ask how many certified engineers you have. They ask what happens to your revenue the day a client's PySpark migration finishes. If the answer is "it disappears," you're not a platform — you're a staffing desk with a Databricks logo.
The four line items that set your multiple
Every Databricks partner's revenue sorts into the same four buckets. The mix between them — not the size — is what an acquirer is actually underwriting. Pull your last twelve months and tag every dollar. Most founders are stunned by what they find.
Bucket 1: Bodies on a project (the multiple killer)
This is staff augmentation and time-and-materials: "We need five data engineers for six months." It feels like the safest revenue you have because the invoices are predictable. To a buyer it's the most dangerous, because it evaporates the day the budget tightens or the migration finishes. It also drags you into a knife fight with offshore shops who'll do PySpark pipeline work at a rate you can't match without torching your margin. The firm that sells at 6x usually has 50-60% of revenue sitting right here.
Bucket 2: Reselling consumption you don't own
Pass-through cloud resale and referral fees. It pads the top line and makes the growth chart look great, but it carries gross margins so thin it actively dilutes the blended number. A buyer strips this out almost entirely when they normalize your financials — so every dollar here is a dollar you carried but won't get paid for at exit.
Bucket 3: Outcome-priced solutions you can resell
This is where the multiple turns. Instead of selling hours, you sell a fixed-price, productized solution — the kind Databricks formalizes through its Brickbuilder program — built on an accelerator you've already debugged on someone else's dime. A "claims-triage model for regional health plans" or a "demand-forecast pack for omnichannel retail." Same engineers, but now the revenue is decoupled from the clock and the IP is yours. Margin expands every time you redeploy it.
Bucket 4: The revenue that shows up whether you sell or not
Managed services for the post-Mosaic-AI world: monitoring data drift, watching model performance, governing Unity Catalog, and running what amounts to FinOps for DBU consumption so your client doesn't get a six-figure bill and rage-churn. This is the bucket buyers pay a premium for, because it shows up on the first of the month no matter what the sales team did. The firm that clears 14x typically has Buckets 3 and 4 making up well over half of revenue — and crucially, has pushed recurring and managed services past the 30% threshold that diligence teams treat as the line between "service shop" and "platform."
Run the tally. The 6x firm and the 14x firm often do identical engineering work. The difference is that one of them billed for it once, and the other turned it into an asset that bills forever.
What you change Monday, in the order that compounds
You don't fix a revenue mix with a rebrand or a new tagline on the website. You fix it one client engagement at a time, starting with the work you've already done. Three moves, sequenced so each one funds the next.
Move 1: Mine your own backlog for a product
Open your last twenty statements of work this week. You will find the same ingestion framework rebuilt four times, or a fraud-detection pattern you've now shipped for three fintechs. That repetition is unpacked IP. Wrap the most-repeated one as a fixed-price solution and submit it through the Brickbuilder program — Databricks then markets it for you, turning your highest-margin offering into a lead channel instead of something you cold-pitch. This is the cheapest move on the list because the engineering is already paid for.
Move 2: Convert one project client into a managed contract
Pick a client whose migration is wrapping in the next sixty days — the exact moment your engineers would normally hit the bench. Don't let the engagement end. Offer a monthly retainer to watch what now matters in the post-MosaicML, agentic-AI era: data drift, model performance, Unity Catalog governance, and DBU spend. "Keeping the lights on" justified almost nothing. "We make sure your AI doesn't silently degrade and your data bill doesn't explode" justifies real money — and it's the bucket that lifts your multiple fastest.
Move 3: Reframe the next deal as risk, not Python
Your next prospect is desperate to deploy GenAI and terrified of leaking proprietary data into it. Walk in as the firm that governs that risk, not the firm that writes the pipeline. When you bill for risk reduction and governed deployment instead of engineering hours, you command a premium rate and you seed Buckets 3 and 4 in the same contract.
The math an acquirer applies is simple enough to do on a napkin: a dollar of managed data-intelligence revenue is worth roughly three dollars of staff-augmentation revenue at exit. If you're going to grow into the Databricks wave anyway, grow into the dollars that get counted three times. Tag your revenue this quarter, pick the one client where Move 2 is easiest, and start there.