
The practical answer
- Short answer
- A 50-point AWS technical due diligence checklist for private equity. Uncover hidden cloud costs, security risks, and technical debt before signing the LOI.
- Best fit
- Industry: Private Equity. Function: Technology Investment
- Operating path
- Technical Debt → Turnaround & Restructuring → Transaction Advisory Services
- Key metric
- 32% of cloud spend is wasted annually due to inefficient architecture (Flexera 2025).
The 'Cloud-Native' Valuation Trap
In the 2026 M&A landscape, the term "cloud-native" has become a dangerous colloquialism. Every SaaS target claims it. Few actually are it. The distinction is not merely semantic; it is a valuation driver worth millions. A true cloud-native architecture scales efficiently, deploying resources only when needed (serverless, containers, auto-scaling). A "lift and shift" architecture—where legacy on-premise servers were simply virtually recloned into AWS EC2 instances—carries the OpEx of the cloud with the rigidity of a data center.
According to the 2025 Flexera State of the Cloud Report, 32% of cloud spend is wasted annually. In the context of a $50M SaaS acquisition with $5M in annual hosting costs, that is $1.6M in EBITDA leakage sitting in plain sight. Multiplied by a 12x valuation multiple, you are looking at a $19.2M valuation gap based solely on infrastructure inefficiency.
When conducting AWS technical due diligence, you must look past the architecture diagram and into the billing console. If the top line item is "Amazon Elastic Compute Cloud (EC2)" running On-Demand instances with low CPU utilization (under 20%), you are not buying a modern SaaS platform. You are buying a legacy data center that happens to be rented from Jeff Bezos. This is not just a technical issue; it is a CapEx bomb waiting to detonate when you attempt to scale the platform post-close.
If the top line item on the AWS bill is 'EC2 On-Demand' with 10% utilization, you aren't buying a cloud-native SaaS. You're buying a legacy data center that happens to be rented from Jeff Bezos.
The 5-Point AWS Audit for the LOI Phase
You do not need a three-week code audit to spot the red flags. You need access to the AWS Cost Explorer and the Trusted Advisor dashboard. Here are the five indicators that reveal the true state of technical debt.
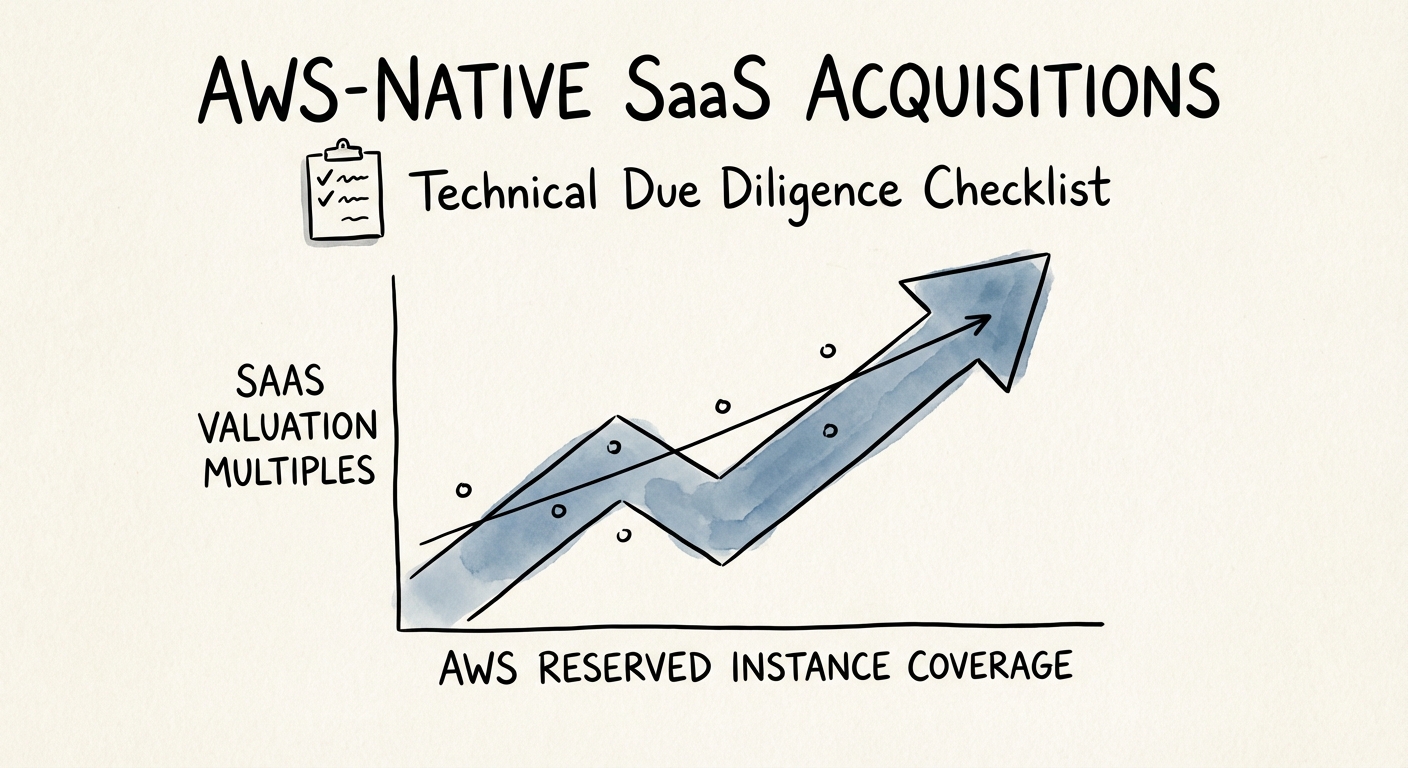
1. The Reserved Instance (RI) & Savings Plan Ratio
The Metric: Coverage should be >80% for steady-state
workloads.
The Risk: Low coverage (<40%) indicates either
a lack of financial maturity or, worse, a highly unstable architecture that engineering
is afraid to commit to. If they haven't bought Savings Plans, they don't know what
their infrastructure will look like in 12 months.
2. The "Inactive Resource" Count
The Metric: Unattached EBS volumes and idle Load Balancers
> 5% of bill.
The Risk: This is a proxy for engineering discipline.
If they cannot clean up unused hard drives costing $50/month, they are certainly
not cleaning up technical debt in the codebase. It signals a "move fast and
break things" culture that has shifted to "move fast and leave trash everywhere."
3. The IAM Permissiveness Score
The Metric: Use of "*:*"
(Admin Access) in IAM roles.
The Risk: In 2025, strategic buyers
are heavily scrutinized on security. If your target has developers with unchecked
admin access to production environments, you are acquiring a breach waiting to happen.
Reference cybersecurity
due diligence benchmarks to understand the liability here.
4. The GenAI "Wrapper" Tax
The Metric: Bedrock/SageMaker spend
vs. API Gateway traffic.
The Risk: With 72% of organizations
now using GenAI (Flexera 2025), many SaaS companies have bolted on "AI
features" that are simply expensive API calls to third-party models. If the
cost of goods sold (COGS) for these features scales linearly with usage, the unit
economics will collapse at scale.
5. The Data Egress Bleed
The
Metric: Data Transfer Out > 15% of total bill.
The Risk:
High egress fees often indicate a poorly architected multi-region strategy or inefficient
content delivery. It is a silent margin killer that typically worsens as you grow
the customer base.
Quantifying the remediation Roadmap
Identifying the debt is step one. Quantifying the cost to fix it is step two. Do not accept a "roadmap" that promises to fix architecture "in Q3." You need to assign a dollar value to the remediation and deduct it from the purchase price or structure it into an earnout.
The "Re-Platforming" Adjustment: Moving from a monolithic EC2 architecture to a containerized (EKS/ECS) or serverless (Lambda) model is not a weekend project. It is a 6-18 month initiative that will consume 40% of your engineering capacity. During that time, feature development will stall. You must model this "Innovation Tax" into your technical debt quantification model.
The "Security Retrofit" Adjustment: If the target has a flat network topology (everything in one VPC) and hardcoded secrets in their code, you are facing a mandatory security overhaul before you can pass a SOC 2 Type II audit. For an enterprise SaaS target, the inability to pass SOC 2 is an existential threat to revenue retention.
The goal of this checklist is not to change the deal. It is to price the deal accurately. If you are buying a "fixer-upper," pay a fixer-upper price. If you are paying a premium for a "platform," ensure you aren't actually buying a pile of technical debt wrapped in a nice UI.