
The practical answer
- Short answer
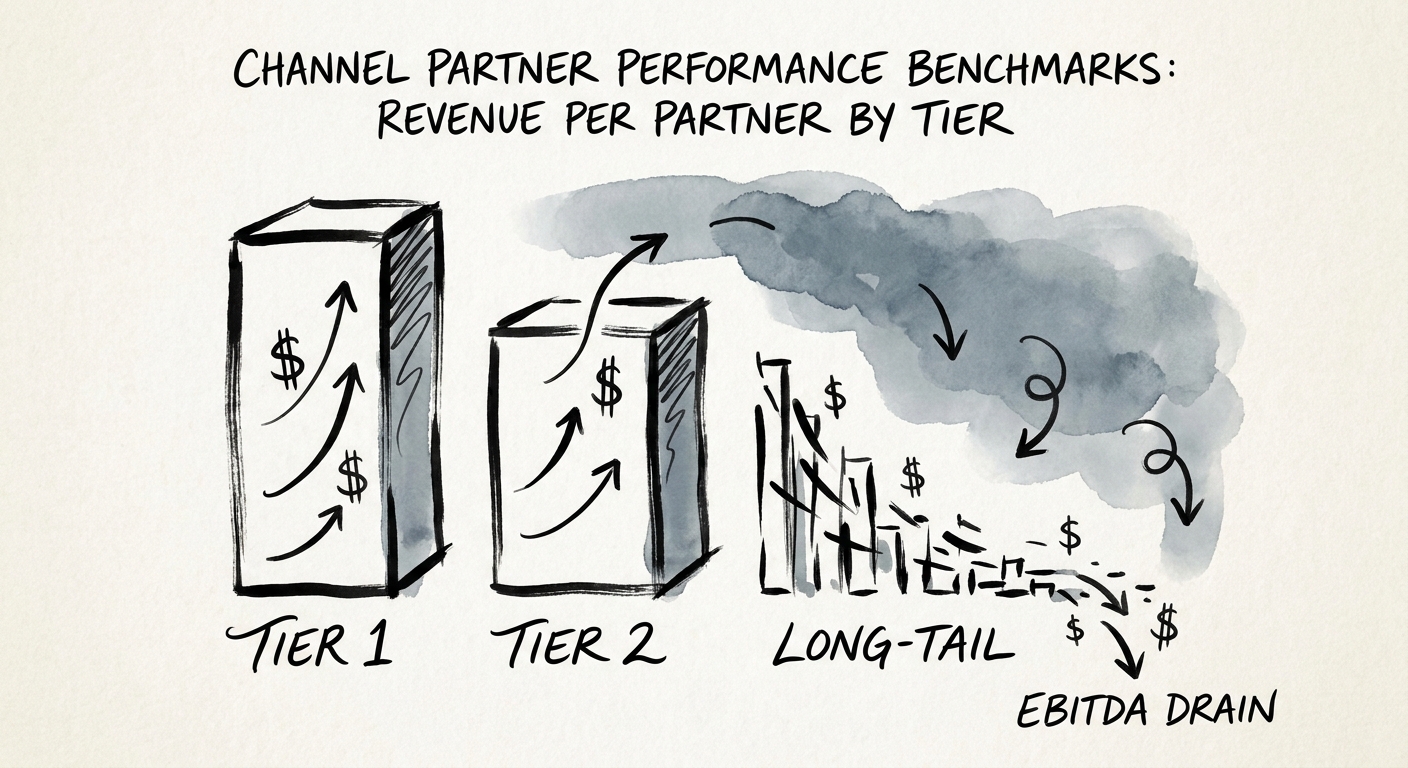
- Most channel rosters hide a tier that costs more to serve than it earns. Here is how to read revenue-per-partner by tier and find the margin underneath.
- Best fit
- Industry: B2B SaaS & IT Infrastructure. Function: Revenue Operations & Channel GTM
- Operating path
- GTM Execution → Commercial Performance → Performance Improvement
- Key metric
- 600% Average Return on Invested Capital (ROIC) generated by Elite and Platinum tier channel partners.
Count the partners who sold nothing last quarter
Open the partner portal of almost any B2B software company with a few thousand logos on the slide, and run one query: how many of those partners closed zero net-new deals in the last four quarters? In the diligence I've run on SaaS and infrastructure channel programs, that number routinely lands north of 60%. Not slow. Not ramping. Zero. Yet most of them still have a portal login, a slice of the marketing development fund (MDF) pool, and a fraction of someone's partner account manager time. They are line items on a cost center that the company files under "ecosystem reach."
The trap is that a partner roster looks like an asset and behaves like a liability. A 4,000-logo channel reads as market coverage in a board deck. On the unit-economics tab it reads as fixed support cost spread across a population that mostly fulfills orders the customer had already decided to place. The signal you actually want is buried one level down: revenue per partner, sorted by tier, with the cost to serve each tier sitting right next to it. That single view tells you whether you're running a go-to-market engine or a subsidy program.
Canalys research on the global IT channel tracks how vendor economics shift when the long tail gets rationalized rather than indulged. The companies that act on that data stop treating partner count as a vanity metric and start treating it as a portfolio to be managed by yield. If you're underwriting an ISV or a tech-enabled services acquisition, this is the cheapest margin in the building — and it's the reason channel revenue so often gets mispriced in a deal model.
A partner roster is a balance sheet, not a trophy case. Half the names on it are liabilities you're carrying as if they were assets.
What the three tiers really cost — and earn
The metal tiers (Platinum, Gold, Silver) are leftovers from the resale era, but they still work as a frame for the only question that matters: what does a partner in this band yield, and what does it cost to keep them there? Treat the numbers below as the shape of the distribution, not a promise — every program's absolute figures differ. What doesn't differ is the spread between the top and the bottom, and the spread is the whole story.
Top tier: a handful of partners, most of the revenue
At the apex sit specialized integrators who attach their own services to your software — implementation, managed support, vertical configuration. A single one of these can drive multiples of any other partner's volume, and the services they wrap around your product make their customers far stickier than a transactional resale ever could. They are expensive to serve: joint business planning, a named partner success manager, real executive time. They are also the only partners whose return justifies that investment, often by a wide margin. The catch is that earning and holding top-tier status is genuinely hard — a dynamic that plays out in the real economics of tier advancement inside large vendor programs.
Middle tier: the only place coaching changes the outcome
The mid-tier is where the program is actually won or lost, and it's the tier almost everyone neglects. These are partners with real capability and incomplete enablement — close enough to the top that focused attention moves them up, under-served enough that a competitor offering better MDF terms can pick them off. The math is unsentimental: time spent dragging a dead Silver partner back to life returns almost nothing, while time spent promoting a top-quartile mid-tier partner compounds. Most channel teams invert this, because the dead accounts are louder.
Bottom tier: a reactive fulfillment network wearing a channel's clothes
The bottom band is where good intentions go to be invoiced for. These partners transact rarely, generate no pipeline, and mostly process orders the customer sourced on their own. Bain & Company's work on B2B route-to-market economics is direct about the drag a reactive partner network puts on overall sales efficiency. Here's the field test I use: if your bottom tier accounts for more than a sliver of total channel revenue while consuming real per-partner support, you don't have a long tail — you have an opportunistic fulfillment network you happen to be subsidizing.
The 90-day rationalization, in order
Knowing the distribution is worthless if you flinch at acting on it. The move isn't a mass purge — it's a controlled re-tiering that costs nothing politically if you sequence it right. First, stop funding by status and start funding by behavior. Replace revenue-band tiering with capability tiering: a partner unlocks margin and support only by holding current technical certifications and sourcing net-new pipeline. This single change re-sorts the roster honestly without you having to fire anyone — the dead accounts self-select into the bottom band because they can't meet the bar.
Second, move the bottom band to self-serve and reclaim the headcount. Low-yield partners go to an automated portal with no dedicated PAM and no guaranteed MDF. You're not exiling them; you're matching the cost to serve to the revenue they produce. The reclaimed time and money then concentrate on the top and the convertible middle — the partners where investment actually returns. That reallocation, from passive resale toward active co-selling, is the same pivot that decides whether modern ecosystem plays succeed, including the co-sell motions that make or break partner-led product attach.
Third, put every MDF dollar on a pipeline leash. Forrester's research on partner ecosystem multipliers finds that a majority of traditional MDF runs with no measured pipeline return at all — money spent on brand-awareness goodwill that never gets reconciled. Convert it to proposal-based, ROI-gated funding: a partner requesting MDF commits in writing to a multiple of that spend in validated, stage-qualified pipeline within the quarter. The funding releases against the commitment. On Monday, you can run the zero-deal query, sort your roster by revenue-per-partner against cost-to-serve, and draw the line under the band that fails the test. Everything above gets investment; everything below gets a self-serve login. That's the whole program.