The practical answer
- Short answer
- A private equity operator's guide to evaluating NetSuite Solution Providers and Alliance Partners. Valuation multiples, due diligence KPIs, and red flags for 2026.
- Best fit
- Industry: Private Equity / Technology Services. Function: M&A / Corporate Development
- Operating path
- Exit Readiness → Operational Excellence → Transaction Advisory Services
- Key metric
- 40% Target AMS Attach Rate: Top-tier partners convert 40% of implementations into recurring managed services.
The 'Valuation Ceiling' of the Service Model
If you are looking at a NetSuite partner, you are likely hearing a founder pitch a \"SaaS-like\" narrative. They will point to their recurring revenue, their cloud expertise, and the 18% YoY growth of the NetSuite ecosystem itself. Do not buy the slide deck.
The first step in any NetSuite partner diligence is to categorize the asset correctly, because the valuation spread between the three primary models is massive. You are either buying a reseller, a consultancy, or a product company. Most targets are a messy hybrid of all three.
1. The Solution Provider (SP) Model
Solution Providers sell the NetSuite license and own the billing relationship. This is the \"sticky\" layer. They earn a recurring margin (typically 10-30% depending on tier and grandfathered terms) on the software license renewals. This revenue is high-margin (90%+) and requires zero delivery headcount. However, Oracle NetSuite has been aggressively squeezing these margins for underperforming partners.
The PE View: We value the license commission stream like a royalty (high multiple), but we discount the services revenue attached to it if it’s purely implementation-based (one-time revenue).
2. The Alliance Partner Model
Alliance Partners provide services only. They do not sell the software; NetSuite Direct sales teams handle the license. These firms are pure professional services organizations. They often have higher enterprise deal flow because NetSuite Direct reps feed them leads, but they lack the \"annuity\" of license renewals.
The PE View: This is a standard professional services play. Valuation is capped at 5x-7x EBITDA unless they have proprietary IP or deep vertical exclusivity (e.g., \"The only NetSuite partner for Life Sciences\").
3. The SDN (SuiteCloud Developer Network) Model
These are ISVs building apps on top of NetSuite (e.g., shipping connectors, tax compliance, AP automation). If the target is an SDN partner, they are a software company, not a services company.
The PE View: These command true SaaS multiples (6x-10x Revenue), provided they have low churn and high attachment rates.
The Trap: Most founders blend these revenue streams in their CIM (Confidential Information Memorandum) to inflate the multiple. Your job is to decouple them. A dollar of implementation revenue is worth 0.80 cents. A dollar of license renewal commission is worth $6.00.
A dollar of implementation revenue is worth $0.80. A dollar of license renewal commission is worth $6.00. If you don't decouple them in the QofE, you're overpaying.
The Quality of Revenue (QofR) Diagnostic
Once you've stripped away the narrative, you need to stress-test the operations. In the IT Services M&A market, revenue mix determines the multiple. For NetSuite partners, we look for three specific \"Red Flags\" in the data room that signal a firm is running on heroics rather than systems.
1. The \"Grandfathered\" Commission Risk
Many older NetSuite partners are sitting on \"evergreen\" commission structures that no longer exist for new partners. Oracle reviews these terms periodically. If 40% of the target's EBITDA comes from license commissions, you must audit their Partner Tier status. If they drop a tier (e.g., from 5-Star to 3-Star) due to missed new business targets, that commission stream can be cut in half overnight. This is binary risk.
2. Utilization Inflation
Founders often claim 85% utilization. In a services business, sustained 85% utilization usually means burnout and delayed projects, not efficiency. We look for a healthy band of 72%-78%. Anything higher implies they are understaffed and one resignation away from a delivery crisis. Anything lower (sub-65%) implies a bloated bench or poor sales-to-delivery handoff.
3. The \"Body Shop\" vs. \"Managed Services\" Ratio
Are they selling hours or outcomes? Staff augmentation is the lowest quality of revenue (easy to cut, low switching costs). Managed Services (AMS) contracts—where the client pays a flat monthly fee for ongoing optimization and support—are the gold standard.
The Benchmark: Top-tier NetSuite partners have an AMS attach rate of 40%+. This means 40% of implementation clients convert into long-term managed services contracts. If the target is at 10%, they are a \"launch and leave\" shop, and their LTV (Lifetime Value) is truncated.
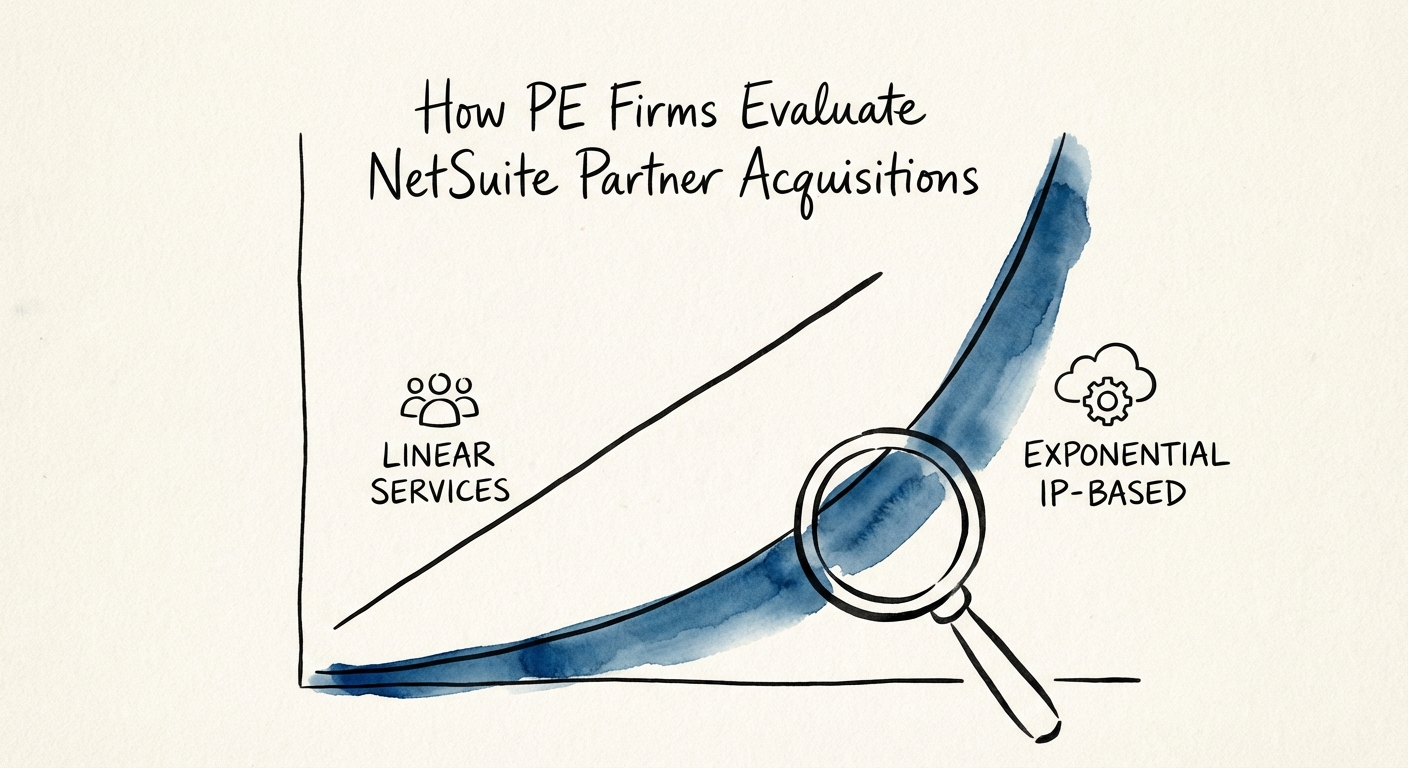
The 'IP Accelerator' Premium
The only way to break the linear relationship between revenue and headcount (the \"services trap\") is Intellectual Property. In the NetSuite ecosystem, this takes the form of Accelerators—pre-packaged code bundles for specific verticals (e.g., \"NetSuite for Craft Breweries\" or \"NetSuite for FDA Compliance\").
When we evaluate a partner, we ask: \"How much of the implementation is configuration vs. coding?\"
- Level 1 (Generalist): Starts from scratch every time. Low margins, high error rate. Valuation: 4x-5x EBITDA.
- Level 2 (Specialist): Has documented SOPs and templates. Better margins. Valuation: 6x-7x EBITDA.
- Level 3 (IP-Led): Installs a proprietary \"layer\" on day one that covers 60% of the client's needs. This reduces delivery cost by 30% and creates vendor lock-in. Valuation: 8x-12x EBITDA.
The Technical Debt Audit
Finally, you must audit the code they are putting into client accounts. A partner that relies on heavy, custom scripting (SuiteScript) for basic functionality is creating technical debt for their clients. Eventually, a NetSuite upgrade will break those scripts, the clients will churn, and the partner will be blamed.
Actionable advice: During technical due diligence, pick three random client accounts and run a \"script health check.\" If you see hard-coded values and lack of error handling, you are buying a liability, not an asset.