The practical answer
- Short answer
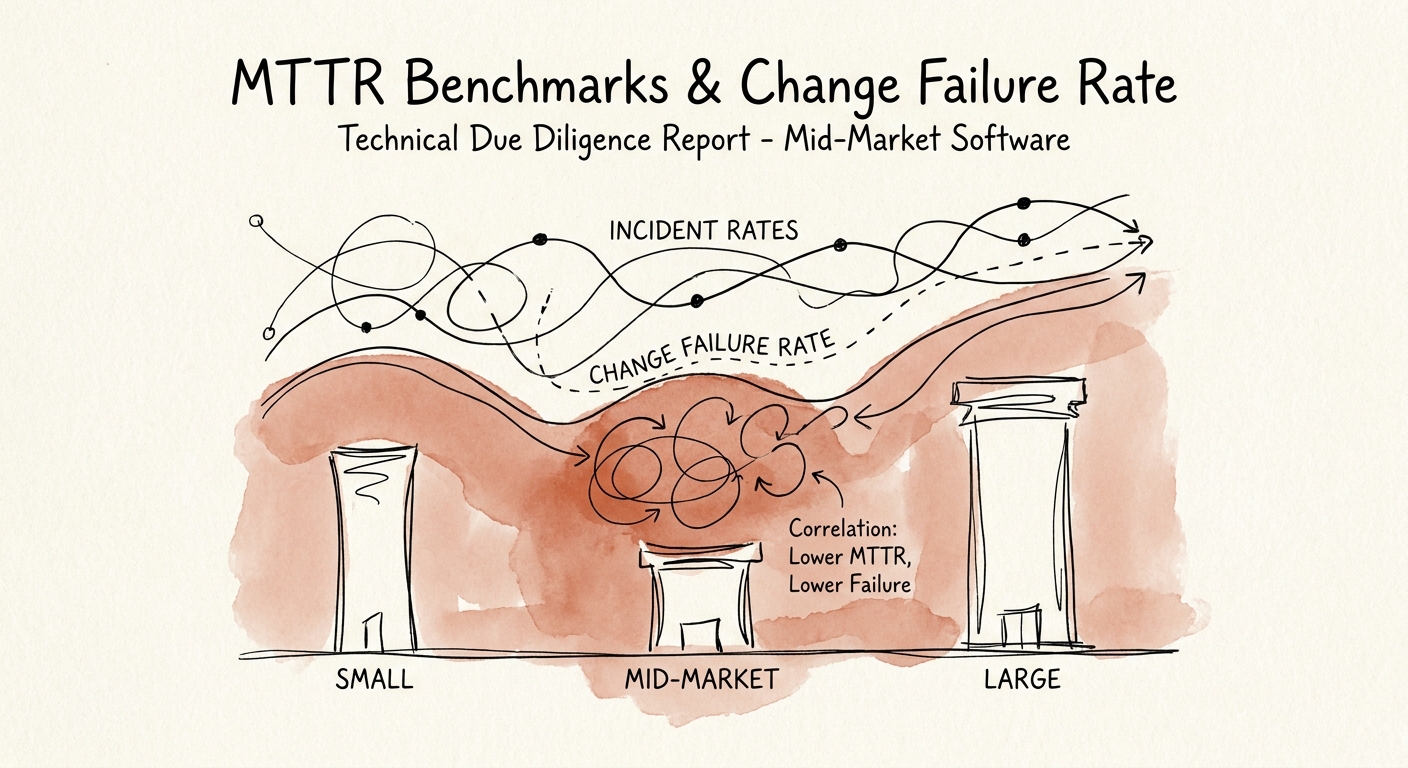
- A 45-minute MTTR can hide a hero culture that breaks prod daily. 2026 MTTR benchmarks by company size, and the one metric you must pair it with.
- Best fit
- Industry: Software & Technology. Function: Engineering Operations
- Operating path
- Technical Debt → Turnaround & Restructuring → Transaction Advisory Services
- Key metric
- 30-40% Faster MTTR achieved by Enterprise organizations compared to Mid-Market counterparts due to Infrastructure as Code.
A 45-minute MTTR walked into a board meeting and lied
The slide said 45 minutes. Median Mean Time to Recovery, down from 90 the prior quarter, green arrow, the whole room nodding. What the slide didn't say was that two engineers had spent the last six Saturdays on undocumented hotfixes, that the on-call rotation was really a rotation of one person, and that the team was recovering so fast because they were breaking production almost every day and had simply gotten very, very good at the rollback. That is the trap with MTTR: it measures how quickly you mop the floor, not whether the pipe keeps bursting.
I have rebuilt engineering organizations inside PE-backed portfolios more than once, and a low MTTR sitting alone on a dashboard now makes me more nervous, not less. The reason is structural. Faros AI's read of the 2025 DORA data describes an "acceleration whiplash" — teams pushed throughput hard, and the probability of a production incident per pull request climbed roughly 242% versus two years prior. So when a target shows me both fast deploys and fast recovery, my first question isn't "how did you get so good?" It's "how often are you actually failing?" Speed of recovery without context is the firefighter bragging about response time while quietly setting the fires.
Here is the counterintuitive part most people get backwards: smaller does not mean faster to recover. The instinct says a lean startup outruns a lumbering enterprise. The data says the opposite at the high end. Palo Alto Networks' benchmarking shows organizations with dedicated, well-staffed teams recovering meaningfully faster than mid-sized peers — on the order of 30 to 40% — because they've made infrastructure disposable. A node misbehaves, they tear it down and redeploy a known-good image. They don't debug the patient; they clone a healthy one. The mid-market can't do that yet, and that gap is where most of the pain lives.
Nobody gets good at recovering from outages without having a lot of outages. A falling MTTR with a rising failure rate isn't a maturing team — it's a team getting more reps at cleaning up its own mess.
The 2026 numbers, read by tier — and what each one is hiding
MTTR is only legible against peers of the same scale and architecture. A number that's healthy at one size is alarming at another. Here's how the tiers actually behave, and the specific lie each tier's MTTR tends to tell.
Enterprise ($500M+ ARR): under an hour — and "under an hour" is table stakes
Elite enterprise teams sit under a 60-minute median, which maps to DORA's top bracket. They get there because recovery is algorithmic, not investigative — immutable infrastructure, automated rollback, redeploy over repair. The diligence read here is inverted: a sub-hour MTTR earns no points. It's expected. What I'm hunting for is the target at this scale that can't hit it, because that means the recovery motion still depends on a human reading logs at 2 a.m., which is a tell for deep architectural debt hiding under the revenue.
Mid-Market ($50M–$250M ARR): 4 to 24 hours — the valley of death
This is the genuinely slow tier, and it surprises people. Mid-market companies outgrew the monolith but haven't funded platform engineering, so they live in a fragile tapestry of legacy services that no single team fully owns. An incident triggers a Slack scramble across three squads, Mean Time to Acknowledge balloons before anyone even starts triage, and recovery stretches into hours. CircleCI's 2025 delivery benchmarks capture this long tail bluntly: top performers cluster near 60 minutes, but the manual-recovery tail drags the global average to 24.3 hours. If a mid-market target shows me a sub-hour MTTR, I don't celebrate — I pull their Change Failure Rate, because a fast number at this scale usually means an engineer who has memorized the rollback command, not a system that fails gracefully. The way to separate the two during a deal is laid out in our guide on operational vs technical due diligence.
Scale-Ups ($10M–$50M ARR): 1 to 4 hours — fast, and dangerously load-bearing
Series B/C teams recover quickly because one or two founding architects hold the entire system in their heads. The system is small enough to be understood by a person, so it is. That's also the risk: this MTTR is a key-person number wearing a metrics costume. The week your lead architect resigns, that 90-minute recovery snaps toward the mid-market range, because the speed was never in the platform — it was in someone's memory. In diligence, a great scale-up MTTR with no runbooks is a liability priced as an asset.
The hidden tax: alerts nobody reads anymore
Chase MTTR hard enough and a predictable failure mode sets in. Teams tune monitoring to alert on every twitch so nothing slips past, and the channel turns to noise. Once the false-positive rate climbs past roughly 60%, engineers start pattern-matching alerts as "probably nothing" and the acknowledgment clock quietly grows. Push it toward 80% and they're closing alerts without opening them. The cruel irony is that the alert flood was installed to protect MTTR, and it's now adding minutes to every real incident while burning out the people on call. That fatigue isn't soft cost — it feeds straight into your technical debt quantification framework as recurring EBITDA leakage you can actually put a number on.
What to do Monday: stop optimizing recovery, start optimizing failure rate
If you're a sponsor or operating partner, the worst thing you can do is walk in and demand a faster MTTR. You'll get one — and you'll get it the cheap way. Engineers will close tickets before resolving root cause and ship hotfixes that buy a week. You'll have incentivized the exact hero culture you were trying to retire. Here's the sequence that actually moves reliability instead of the number.
1. Never read MTTR without Change Failure Rate next to it
These two move together in a healthy org and diverge in a sick one. MTTR down, CFR up is the signature of a team getting more practice at fixing its own breakage — not better engineering. MTTR down and CFR down together is the only combination worth applauding. Make the dashboard show both on the same panel; if leadership resists putting CFR on the slide, that resistance is itself the finding.
2. Audit where the clock starts — most "fast" MTTRs cheat on detection
A sub-hour recovery means nothing if Mean Time to Detect is measured in days because the clock doesn't start until a customer files a support ticket. Before you trust any MTTR figure, ask one question: who or what notices the incident first? If the honest answer is "an angry user," the impressive recovery time is measuring the wrong race. Fund observability that catches degradation before it cascades, and you'll often watch a "great" MTTR get temporarily worse — because you finally started counting the part that was hidden.
3. Buy platform engineering, not heroics
Breaking the mid-market ceiling means converting a reactive ops team into a platform team: standardized CI/CD, infrastructure as code, automated rollback, the goal being that no human is required to perform a recovery by hand. This is a real line item, and the way to win the board vote is to frame it against the cost of the status quo — our analysis of technical debt percentage benchmarks by company stage gives you the financial case for the spend.
So the next time engineering leadership presents a falling MTTR as a clean win, don't congratulate the number. Ask how often production breaks, who notices first, and whether the recovery survives the departure of one specific person. A mature organization doesn't brag about how fast it puts out fires. It rebuilds the structure so the fires stop starting.