The practical answer
- Short answer
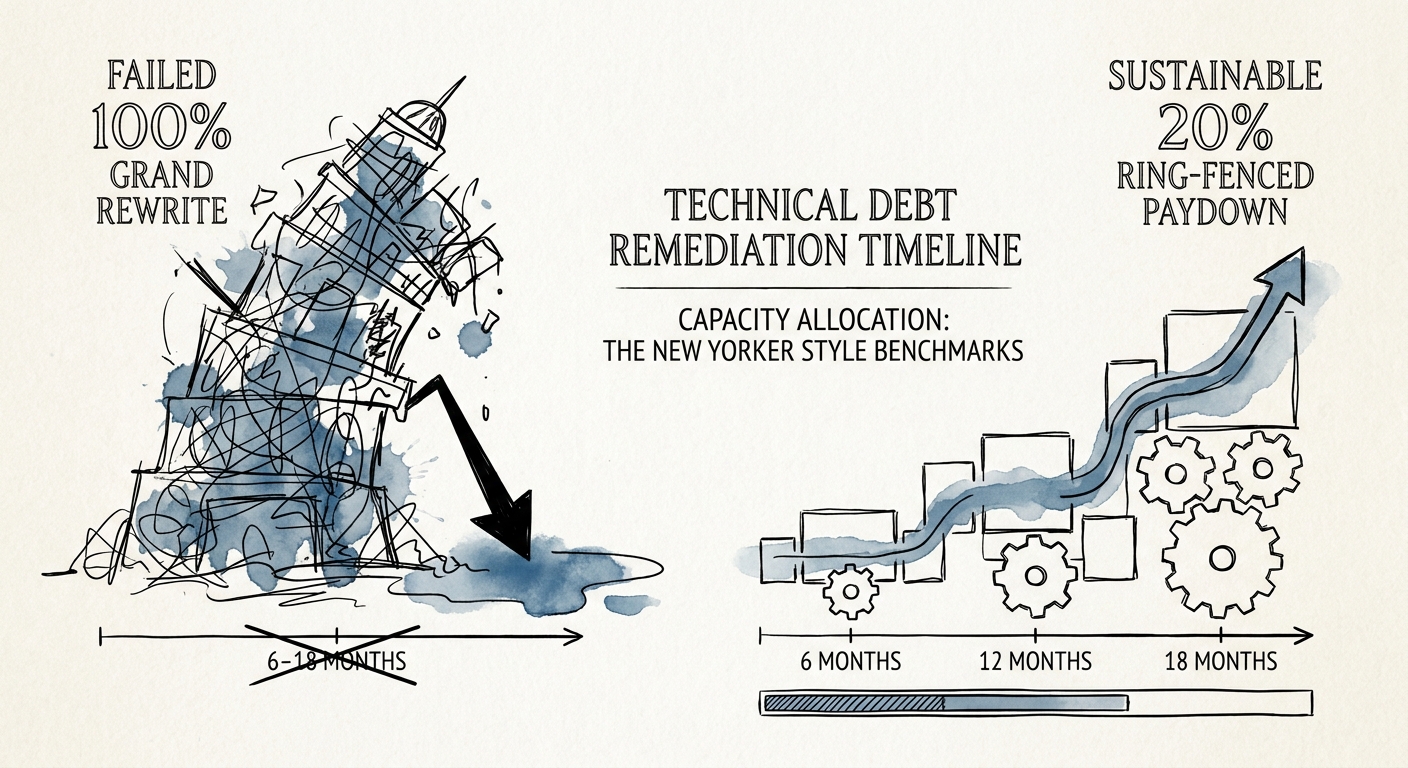
- A month-by-month tech debt remediation timeline for PE-backed SaaS: the gate checks at month 3, 9, and 18 that keep a rewrite from torching your hold-period EBITDA.
- Best fit
- Industry: B2B SaaS / Technology. Function: Engineering / Technology Operations
- Operating path
- Technical Debt → Turnaround & Restructuring → Transaction Advisory Services
- Key metric
- 15-20% Engineering capacity that must be ring-fenced for continuous technical debt paydown to ensure product roadmap survival.
The clock you are actually fighting
The new CTO at a $40M ARR logistics SaaS platform walked the board through a clean, confident plan: twelve months to rewrite the monolith, then back to shipping features at full speed. It sounded like discipline. By month nine the feature roadmap had been frozen for three quarters, two anchor renewals were wobbling because a long-promised integration never shipped, and the engineering team was maintaining two codebases that did the same thing differently. The rewrite was 60% done, which in rewrite math means it was nowhere.
I have walked into this exact movie three times across different portfolios, and the trap is never the engineering. It is the calendar. A standard hold period is roughly two years from your seat as an operating partner, and two years is about 26 two-week sprints. A CTO who spends the first six sprints on a ground-up rewrite has consumed a quarter of your hold before a single customer notices anything changed. The grand rewrite is not wrong because the old code is fine. It is wrong because the timeline does not have room for a feature freeze and a value-creation story at the same time.
So the real question on day one is not "rewrite or refactor." It is "what has to be true at month 3, month 9, and month 18 for this to read as margin at exit instead of a line item in the deductions schedule." The first ninety days are pure triage, and triage means deciding what you will deliberately not fix. You ring-fence a fixed slice of capacity for debt paydown and protect it like a renewal date. McKinsey's analysis of reclaiming tech equity puts that sustained allocation around 15 to 20 percent of engineering capacity. Below that, the interest compounds; above 40 or 50 percent, you have quietly started the rewrite you swore you wouldn't. The month-3 gate check is simple: have you isolated the one or two modules that account for most of your unplanned work — usually the billing engine or a shared database schema everything reaches into — and wrapped them so the rest of the system stops inheriting their failures?
Two years is roughly 26 sprints. A new CTO who burns the first six on a full rewrite has spent a quarter of your hold period before a single new customer notices the difference.
Months 6 to 12: the dip you have to budget for
The middle stretch is where most timelines quietly slip, because this is the window where the work looks worse before it looks better. You are pulling high-risk pieces out of the monolith one at a time — strangling the old paths, routing live traffic to new services — which means for several months you are running and maintaining both versions at once. Output dips. That is not a failure signal; it is the cost structure of the approach. The failure signal is when nobody warned the board it was coming, so the month-7 velocity report lands as a surprise instead of a planned line on a chart drawn in month 3.
This is the gate where you stop counting bugs and start counting reclaimed hours, because that is the metric a finance audience can underwrite. Stripe's Developer Coefficient study found developers lose about 13.5 hours a week — nearly a third of the working week — to debt, debugging, and infrastructure friction. Frame that for the board the way it actually cashes out: cut that drag meaningfully across a 25-person team and you have effectively added headcount you never put on payroll. By the month-9 check, the question is whether your instrumented "time lost to friction" number is visibly bending down, not whether the architecture diagram looks tidy.
Where the operating partner earns the seat
The hardest fight in this window is not technical, and it is not the CTO's to win alone. Product will argue, correctly from their vantage, that the capacity ring-fence is starving the roadmap. Left unmanaged, that pressure caves the 20 percent allocation back to zero by month eight and you are back where you started with a quarter of the hold gone. This is where the operating partner provides top cover and translates the work into the only currency the board scores: cycle time and time-to-market. MIT Sloan's research on managing technical debt shows that removing architectural bottlenecks can accelerate feature delivery by up to 50 percent in the second year of remediation. That is the whole bargain in one sentence: you trade a visible, planned dip in the second half of year one for a step-change in shipping speed in year two — the year your exit narrative gets written.
Months 12 to 18: turning the rebuild into a number
By the twelve-month gate the structural work is largely behind you, and the job changes from doing the remediation to making it legible to a buyer. The board-level metrics rotate: deployment frequency, mean time to recovery, and infrastructure spend per dollar of revenue. The reason this matters for valuation and not just for engineering pride is that none of it survives diligence unless it is measured and trending. Gartner's IT spending benchmarks describe how unmanaged debt quietly eats a large share of the IT budget through reactive maintenance and hosting overhead — which means every point of that drag you remove shows up as recurring margin, not a one-time cleanup.
Mature CI/CD and automated testing do two things to the P&L at once. They retire the manual QA hours and weekend deploy-war-room overtime that never sat in anyone's budget line, and they shift engineers from patching defects to building shippable product. The part a buyer's diligence team actually cares about, though, is the discount you avoid. Bain's work on technology in M&A finds acquirers haircut valuations meaningfully when a critical platform lacks modern deployment automation and carries a high debt ratio. An 18-month rebuild with a clean deployment-frequency chart and a measured MTTR is how you walk into that room with evidence instead of explanations.
So if you are sitting at the start of a hold and weighing this: don't approve a remediation plan that doesn't come with the three gate dates already drawn. Ask your CTO what is finished by month 3, what the planned dip looks like by month 9, and which exit metrics are instrumented and trending by month 18. A plan that can't answer those is a rewrite wearing a roadmap's clothes. One that can is among the higher-yield moves in a value-creation plan, because it converts a diligence liability into recurring margin — and it does it inside the only window you actually have.