
The practical answer
- Short answer
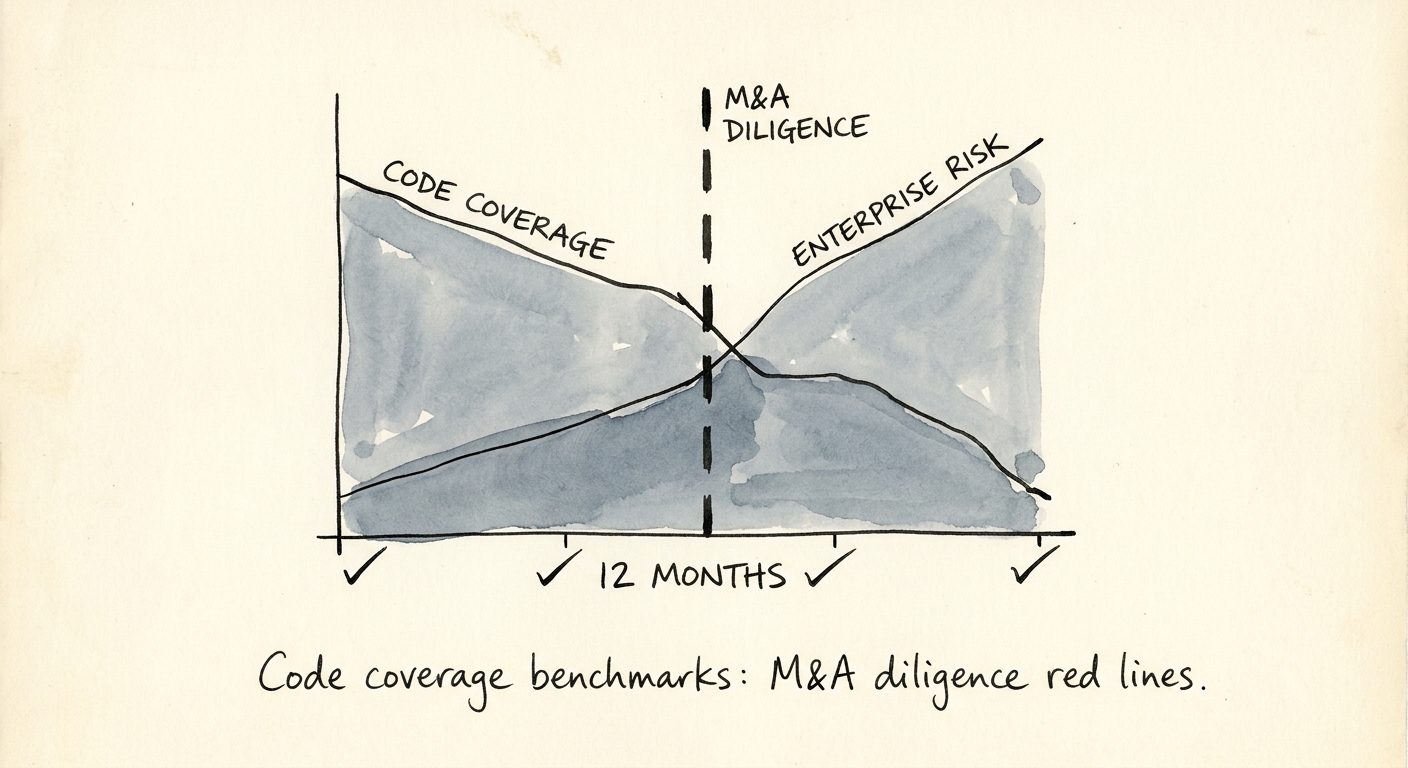
- A high coverage number can hide an untested billing engine. The exact code-coverage thresholds, trend signals, and distribution checks PE buyers run on SaaS deals.
- Best fit
- Industry: Software & Technology. Function: Engineering & DevOps
- Operating path
- Technical Debt → Turnaround & Restructuring → Transaction Advisory Services
- Key metric
- < 40% M&A Red Line: Immediate valuation discount applied for heavy manual QA dependency.
The 94% that lost a turn
A founder I sat across from in a data room led with a single slide: 94% code coverage, green across the board. He thought it was his strongest card. The buyer's technical lead spent four minutes inside the actual coverage report and quietly took a turn and a half off the EBITDA multiple. The reason was visible the moment you stopped reading the headline number. Roughly a third of the test suite was exercising getters, setters, and config loaders — code that cannot meaningfully break. The payment-processing module, the one piece that touches money on every transaction, sat almost naked underneath all that green.
That is the trap with coverage in a SaaS deal. The metric is real, but it is a single scalar standing in for a thousand decisions about what got tested, and a scalar can be gamed in an afternoon. When I read a coverage report during diligence, I am not asking "how high is the number." I am asking what the number is hiding. A team chasing 100% is telling me their engineering culture optimizes for a dashboard, not for the code paths that generate revenue. A team sitting at 25% is telling me a single senior leaving could freeze the product. Both are risk signals, just pointed in opposite directions — and both get priced.
The stakes here are not abstract. The Consortium for Information & Software Quality (CISQ) Technical Debt Index puts the cost of poor software quality and technical debt in the US at $2.41 trillion. A buyer underwriting your company is, in effect, deciding how much of that liability they are inheriting. Untested critical paths do not vanish at close; they reappear as a remediation line in the buyer's first-100-days budget, and that budget gets funded out of your purchase price. Most technical diligence frameworks — see the APIpilot technical due diligence guide — treat test strategy, maintainability, and delivery risk as first-order questions, not footnotes. Coverage is the entry point to all three.
A coverage number tells me how much code you tested. It tells me nothing about whether you tested the code that prints your invoices. Those are different questions, and only one of them moves the multiple.
The three thresholds buyers actually use
Inside a typical 30-day technical diligence sprint, coverage gets bucketed against three bands, and each one triggers a different conversation. Knowing where you land before a buyer does is the difference between negotiating from a thesis and reacting to a finding.
Below 40% — the red line. A sub-40% line-coverage figure tells the buyer your release safety net is a human one. Every deploy leans on manual QA, defect escape rates climb, and the cadence between "code complete" and "in production" stretches. The buyer's response is mechanical: they model the cost of an automated-test retrofit, scale it to your codebase size, and either knock it off the price or park it in escrow. There is no charitable interpretation at this level — it reads as a structural gap, not a stylistic choice.
60% to 75% — the band you want to be in. A target around 70% is widely treated as the equilibrium between reliability and shipping speed, per LTS Group's 2025 Tech Debt Benchmark Guide. What a buyer wants to see in this band is not the number itself but the shape of it: dense automated coverage on business logic, billing, and authentication, with UI surfaces and third-party integrations covered by a thinner layer of targeted end-to-end tests. That distribution says the team spends its testing budget where failure is expensive and economizes where it is cheap. If you are heading to market under 60%, do not launch a coverage-everywhere crusade — stop the grand rewrite and retrofit tests onto your highest-risk modules first.
Above 85% — the vanity zone. Past roughly 80%, each additional percentage point buys less safety and more brittleness. The 95% suites I audit are almost always padded with snapshot tests that shatter on a one-pixel UI change and assertions so tightly coupled that a routine refactor turns red across hundreds of files. That is testing debt: a tax that quietly lengthens lead times and makes the team afraid to change anything. The pressure is rising — an X-Team technical debt analysis notes that many technology leaders expect their org's technical debt to hit high-severity levels by the end of 2026. Buyers run automated scanners precisely to surface these gaps, then convert what they find into escrow holdbacks or price adjustments.
Read the trend and the map, not the number
The single coverage snapshot is the amateur's metric. Two reads beat it, and experienced buyers run both.
The first is the trajectory. A repo sitting at 65% today but bleeding roughly a point of coverage a month is a worse asset than a stable 55%, because the slope tells you the team is shipping features without tests — discipline is eroding in real time. Count.co's 2026 SaaS Coverage Trends frames healthy platforms as ones holding a small positive monthly trend, enough to stay ahead of natural code decay. Pull your own twelve-month coverage history before a buyer does; a flat or rising line is a far stronger story than a high static number with an unknown direction.
The second read is distribution, and it is where deals actually turn. On a tech-enabled services carve-out I worked, the target proudly showed 82% global line coverage. We ignored the headline and pulled the per-module map. The revenue-recognition engine — the exact component the investment thesis was built on — sat at 14%. That one chart converted a clean all-cash structure into a performance-weighted earnout, because the buyer was no longer willing to pay full freight for a revenue path nobody had tested. This is why the technology due diligence checklist for software acquisitions pushes for branch coverage on critical paths rather than aggregate line coverage: branch coverage on your billing flow tells the truth that a global average is designed to obscure.
There is a security edge to this too. Untested branches in legacy code are where edge-case vulnerabilities live, and Bain & Company's 2026 Cybersecurity Outlook warns that AI-enabled attacks are increasingly hunting exactly those gaps — raising the security spend buyers expect to inherit. So here is what to do this week, well before any term sheet: pull coverage broken out per module, not in aggregate; flag every revenue-touching component below 60% branch coverage; and treat closing those specific gaps as the same priority you would give a financial restatement. The buyer is going to read your code the way they read your P&L. Hand them a number that survives the second look.