The practical answer
- Short answer
- The synergy model never priced the developer slowdown, the Month 6 churn cliff, or the comp-plan exodus. Where bolt-on EBITDA actually leaks — and how to plug it.
- Best fit
- Industry: Private Equity & SaaS. Function: M&A Integration
- Operating path
- Migration & Integration → Turnaround & Restructuring → Transaction Advisory Services
- Key metric
- 41% Plunge in engineering productivity during the first six months of tech stack consolidation.
The synergy line item that had no cost line under it
Open any bolt-on model and you'll find the same shape: a fat cross-sell number stacked on top of the target's revenue, a cost-takeout line for the duplicate G&A, and an integration budget pinned at roughly 3% of deal value because that's what the last one ran. What's missing is the entry that actually decides the deal — the cost of the eighteen months where the two companies are neither separate nor merged, just colliding. Bain & Company's 2025 Global M&A Report puts a number on the collision: 72% of bolt-ons are still dragging on EBITDA eighteen months after close. The thesis isn't wrong. The sequencing is.
The first cost shows up in the place the model assumes is "free": engineering. The morning the platform's CTO decides the acquired team will move repos, re-platform their CI/CD, and adopt the parent's deploy tooling, velocity falls off a shelf. McKinsey's Developer Velocity Index tracks the slide — engineering productivity drops about 41% across the first six months of stack consolidation. Picture a 25-person product team at the target shipping weekly. Through Q1 they're not shipping features; they're in a Slack war about Terraform versus the parent's hand-rolled config and which CI runner is "blessed." The joint roadmap — the exact thing that justified the multiple — slides three to four quarters right. You bought top-line synergy and you're funding a refactor of debt nobody priced in diligence.
The operators who avoid this don't merge the stacks in year one. They wire the two products together with an API federation layer, ship the cross-sell bundle on top of two separate backends, and let the deliberate consolidation happen later — after the deal has already started paying for itself, not while it's bleeding. Slower on the architecture. Faster on the synergy that's actually in the model.
The bolt-on didn't fail at the LOI. It failed the morning someone said "let's just put them on our comp plan" — and three quota-carriers updated their LinkedIn by lunch.
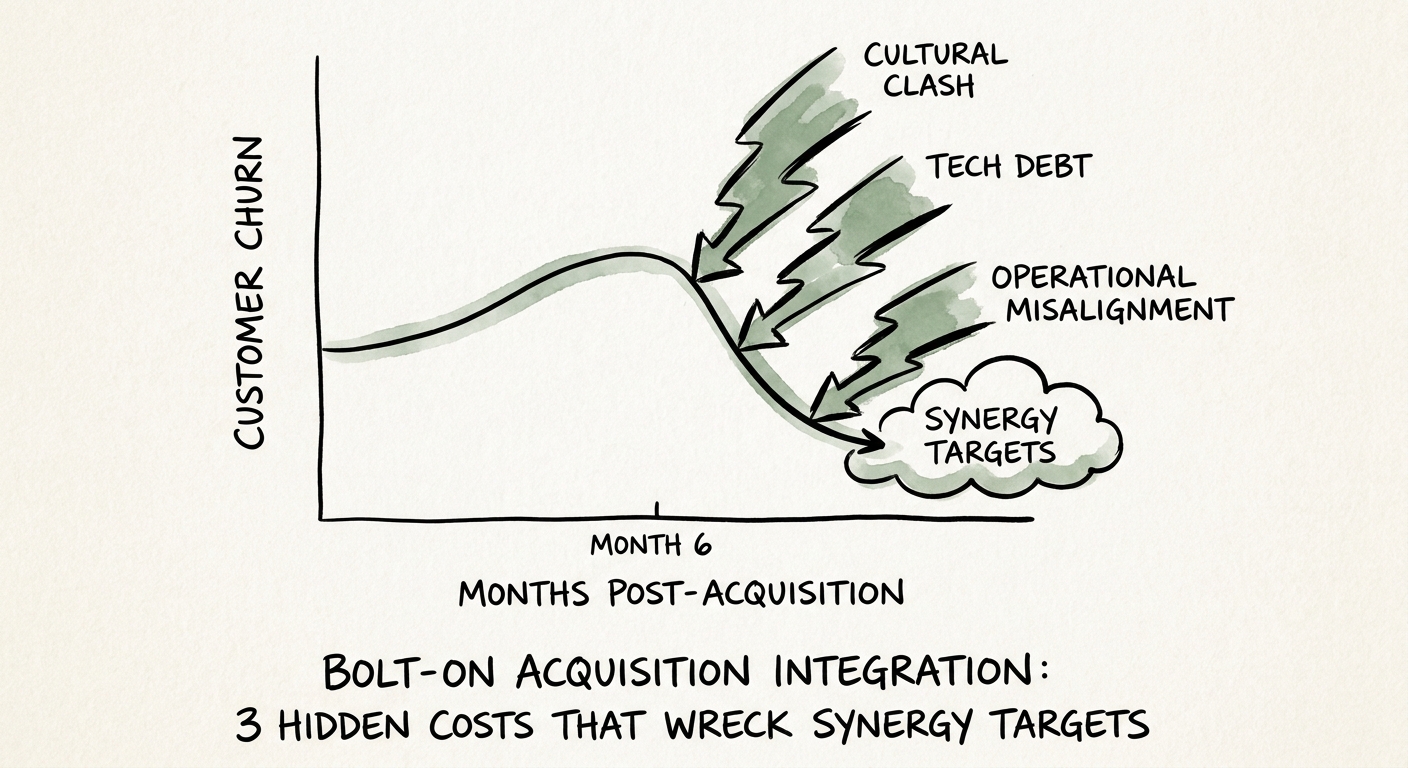
The churn doesn't spike on Day 1. It waits until Month 6.
Day 1 is theater, and operating partners are good at it: the announcement email, the "nothing changes for you" reassurance, the all-hands. Customers nod. Nothing changes for them — yet. The trap is assuming that calm holds. Gartner's 2025 B2B Customer Retention Analysis finds acquired customer bases hit an 18% churn spike specifically between months five and seven post-close. Not Day 1. Not Month 12. A narrow, ugly window in the back half of year one.
The mechanism is mundane, which is why it gets missed. For the first quarter, the acquired account managers keep doing the proactive health checks and the quiet saves that built the retention number you underwrote. By Month 5 those same AMs are buried — learning the parent's CRM, getting measured against unfamiliar KPI frameworks, fielding product roadmap changes they can't explain to customers. They go from playing offense on accounts to playing defense on internal compliance. The customer never gets a breakup email; they just notice nobody's called in two months, and a hungrier competitor has. The neglect is invisible right up until it shows in the renewal report.
Say a platform acquires a compliance-software bolt-on and, chasing top-down pipeline visibility, force-merges both Salesforce instances in month two. The acquired AMs spend the back half of the year reconstructing account history instead of touching customers — and the bolt-on's biggest, stickiest accounts are exactly the ones that feel the silence first. The renewal slope on the top tier rolls over right on schedule, in the month-five-to-seven window, and that's revenue you can't model your way back into. The Month 6 Cliff breaks the timing down further. The fix is unglamorous and it costs money on purpose: ring-fence the acquired customer success team for nine months and eat the duplicated tooling and headcount. Trading a renewal cohort to retire a few software licenses a quarter early is the worst rate of exchange in the deal.
The comp plan is the resignation letter you hand them
The third cost arrives the day someone "harmonizes" sales comp. The platform wants one plan, one quota framework, one territory map — clean, auditable, consistent. To the target's top reps, "consistent" reads as "your accelerators are gone, your territory got carved, and your number went up." Harvard Business Review's work on post-acquisition talent retention shows what happens next: 34% of top-performing reps at acquired tech firms walk within 120 days when comp is harmonized immediately. These aren't replaceable seats. They're the people who personally carry the relationships your cross-sell synergy assumes will convert. Lose them and the synergy line doesn't slip — it evaporates, because the conduit to those accounts left with them.
The replacement math is brutal. PwC's 2025 Global M&A Industry Trends puts the fully loaded cost of replacing an enterprise rep — search fees, roughly nine months of ramp, and the pipeline that dies on the way out — near $315,000 per departure. Run that across a 20-person commercial org losing a third of its best people and the entire integration budget is underwater before the cross-sell ever booked a dollar. The replacements also don't inherit the relationships; they inherit a CRM record and a cold intro.
So you do the thing that feels wrong on the synergy model and right on the EBITDA: you don't harmonize comp in year one. Leave the bolt-on reps on their legacy plans through the first full fiscal year and budget, deliberately, for overlapping commissions on the deals that span both books. Double-paying a handful of enterprise deals is a rounding error next to losing the people the multiple was built on. Our breakdown of what PE firms actually spend on integration baselines these numbers honestly. The pattern across all three costs is the same one the model fights you on: real synergy is patient, and forcing the merge early is the fastest way to destroy the value you just wrote the check for.