The practical answer
- Short answer
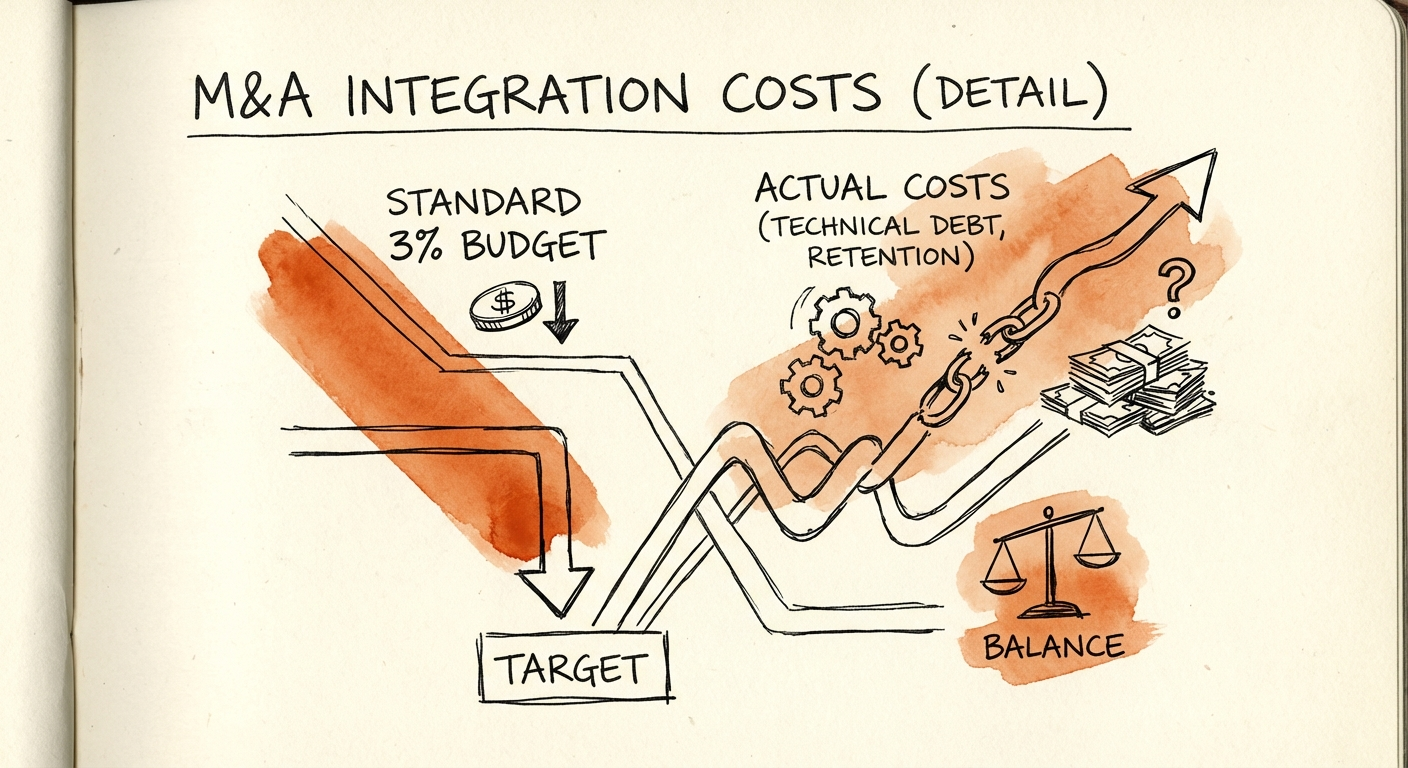
- Stop budgeting 3% for integration. Discover the Total Cost of Unification (TCU) framework and accurate benchmarks for PE-backed tech and services acquisitions.
- Best fit
- Industry: Private Equity / Technology. Function: M&A Integration
- Operating path
- Migration & Integration → Turnaround & Restructuring → Transaction Advisory Services
- Key metric
- 10% The realistic integration budget as a percentage of Target Revenue for tech deals, compared to the generic 3% of Deal Value.
The "Spreadsheet Reality" vs. Operational Reality
If you are an Operating Partner at a PE firm, you have seen the slide in the Investment Committee (IC) deck. It’s usually Slide 42, buried in the appendix: "Integration Costs estimated at 3% of Deal Value."
It looks reasonable. It fits the model. It preserves the IRR.
It is also a hallucination.
In 2026, relying on a flat percentage of Enterprise Value (EV) to calculate integration costs is widely considered malpractice in mid-market tech. While generalist studies from firms like EY cite a 3% average across all sectors, the reality for technology and tech-enabled services is brutally different. Recent data shows that for TMT (Technology, Media, Telecom) assets, median integration costs are actually running between 5.6% and 10% of target revenue, often decoupling completely from the purchase price.
Why the discrepancy? Because deal value fluctuates with market multiples, but the cost to merge two Salesforce instances, sanitize 4 terabytes of data, and retrain 200 sales reps remains fixed. When you buy a $50M ARR company for 8x EBITDA versus 12x EBITDA, the integration work doesn't shrink by 33%. In fact, lower-multiple deals often imply higher technical debt, meaning your integration costs inverse to deal value.
The "3% Trap" leads to a predictable cycle of value destruction: you under-budget for IT and process unification, leading to a "duct-tape integration." Six months post-close, you encounter the Month 6 Cliff, where key talent leaves because systems are broken, and customers churn because billing integration failed. You didn't save money; you just deferred the cost and added a synergy tax.
The integration phase is the only way to properly evaluate the outcome of a deal. Yet, 38% of executives admit they would have increased their budget by up to 50% in hindsight.
The "Total Cost of Unification" (TCU) Formula
Stop using "percent of deal value" as a budget driver. Instead, use a bottom-up Total Cost of Unification (TCU) approach. This framework forces you to price the activities required to unlock value, rather than picking a number that makes the deal model work.
The TCU Formula
TCU = (Technical Hard Costs) + (Organizational & Change Costs) + (Compliance Remediation) + (Contingency)
1. Technical Hard Costs (The Fixed Floor)
This is where the budget usually breaks. Do not estimate this; get quotes during diligence.
- Infrastructure Consolidation: Costs to migrate cloud tenants (AWS/Azure) and retire legacy data centers. Benchmark: $5k-$10k per server workload.
- App Rationalization: The cost to kill shadow IT. If the target has 500 employees, they likely have 120+ SaaS apps. Benchmark: $500 per user for license overlap during the 12-month transition.
- Data Migration: The "Zero Defect" requirement. Moving CRM and ERP data without losing history. Benchmark: $100k minimum for basic mapping, scaling up to $1M+ for messy ERPs.
2. Organizational & Change Costs (The Value Protectors)
This is not just severance. It represents the cost of retention and productivity maintenance.
- Retention Bonuses: Critical for Engineering and Sales leadership. Benchmark: 10-20% of annual salary for key personnel, paid out over 12-18 months.
- Cultural Alignment: Workshops, travel, and communications. Benchmark: $1,500 per employee.
3. Compliance & Security (The Debt Paydown)
If you are moving a Founder-led firm into a PE portfolio, you are likely inheriting "Security Debt."
- SOC 2 / CMMC Upgrade: Getting the acquired entity to your platform's standard. Benchmark: $150k - $250k one-time remediation cost.
4. The "Unknown Unknowns" Contingency
Standard project management dictates 10%. M&A integration requires 20-25%. This covers the inevitable discovery of undocumented custom code or broken billing logic that no Quality of Earnings (QofE) report could find.
Execution: Selling the "High" Budget to the IC
Presenting a $3M integration budget on a $50M acquisition will raise eyebrows. The Investment Committee will ask, "Why is this so high? The spreadsheet said $1.5M."
Your answer must shift the frame from Cost Center to Synergy Enabler.
You are not asking for $3M to "fix IT." You are asking for $3M to secure the $10M in cost synergies and the $5M in cross-sell revenue you promised in the deal thesis. Without the CRM migration (Hard Cost), the cross-sell cannot happen. Without the SOC 2 remediation (Compliance Cost), the enterprise value at exit is capped.
The "Synergy Validation" Play
Use the 5-Day Operational Assessment during exclusivity to build this budget. When you present to the IC, map every dollar of integration spend to a dollar of EBITDA expansion.
- Spend: $500k on ERP Integration → Return: $2M annual savings in Finance headcount reduction (Day 180).
- Spend: $300k on Sales Training & Enablement → Return: 15% uplift in Win Rate (Day 90).
By tying the budget to the 100-Day Value Creation Plan, you protect yourself from the accusation of over-spending. You also protect your future self from the misery of managing a stalled integration with zero budget left to fix it.
Remember: The most expensive integration is the one you have to pay for twice—once to do it cheaply, and once to fix it.