
The practical answer
- Short answer
- Why Adobe Experience Platform (AEP) projects stall and how to fix them. A diagnostic guide for executives on preventing data governance stalls and selecting the right implementation partner.
- Best fit
- Industry: MarTech / Enterprise Software. Function: Customer Success / Implementation
- Operating path
- Process Documentation → Operational Excellence → Transaction Execution Services
- Key metric
- 17% of marketers reporting high CDP utilization in the cited Gartner research.
The Diagnosis: Why AEP is Not Just 'Bigger Marketo'
For many PE-backed operators and scaling executives, Adobe Experience Platform (AEP) represents the Holy Grail of customer data: a single, real-time profile that unifies the messy reality of enterprise data. Yet, despite massive investment, a 2024 Gartner report highlights a sobering statistic: only 17% of marketers report 'high utilization' of their Customer Data Platforms (CDPs).
The discrepancy between investment and utilization is rarely a software failure. It is a process failure. AEP is frequently mis-sold or mis-bought as a marketing tool—a "super-sized" Marketo that a marketing operations team can configure in a quarter. In reality, AEP is enterprise data infrastructure. It requires the rigor of an ERP implementation, not the agility of a campaign launch.
We consistently see projects stall due to the "Hero Architect" syndrome. A brilliant technical lead manually maps hundreds of schemas and data flows without documenting the governance logic. When that architect leaves—or simply burns out—the project hits what we call "Data Gravity." The sheer weight of undocumented custom schemas makes the system too risky to touch, freezing innovation. As discussed in our analysis of hero culture transitions, this dependency is a primary driver of valuation haircuts during due diligence.
AEP is not a tool you log into; it's a machine you build. If you treat it like Marketo, you will fail. It requires the rigor of an ERP implementation, not the agility of a campaign launch.
The Metrics: 'Profile Richness' as a Proxy for Technical Debt
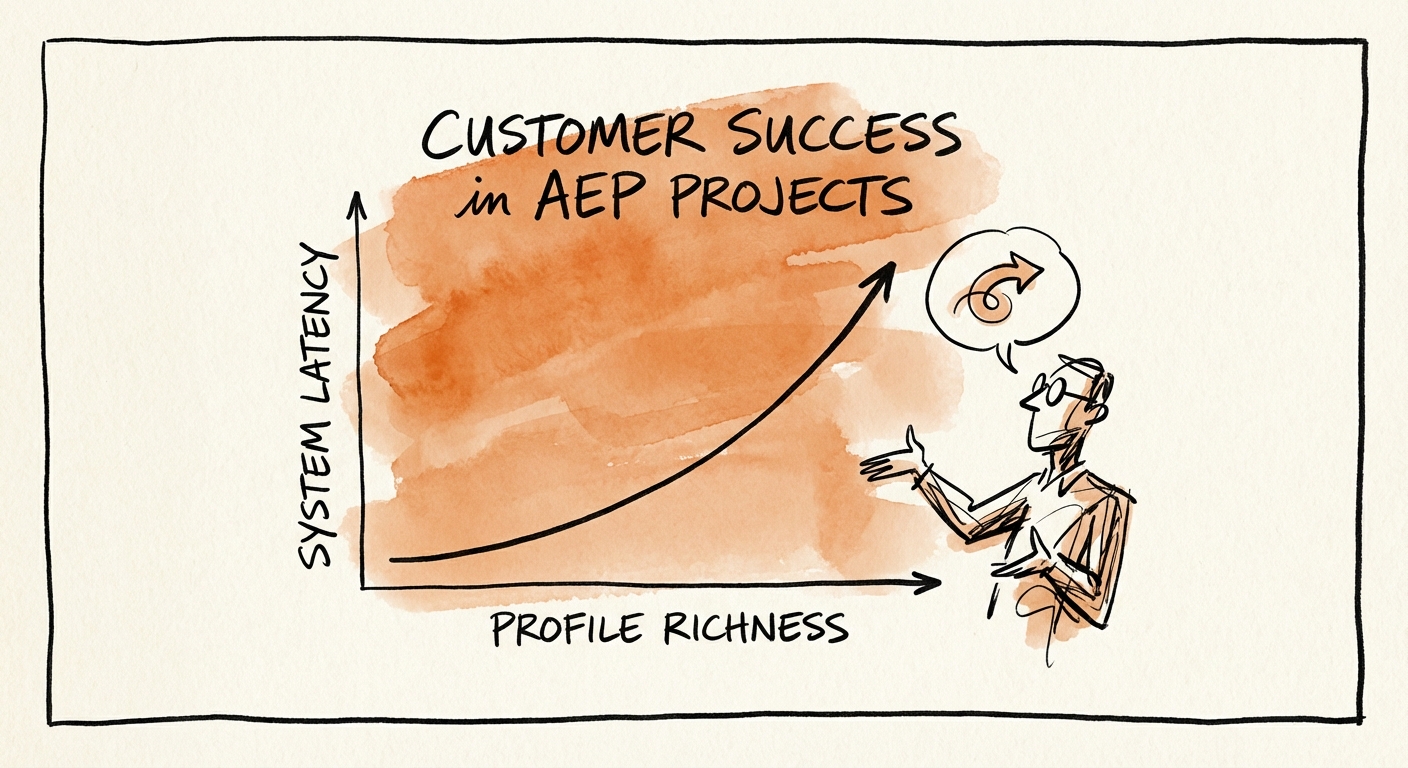
How do you know if your AEP implementation is heading toward a stall? Stop looking at "use cases delivered" and start looking at technical health metrics that predict future velocity. The most critical, yet often ignored, metric is Average Profile Richness.
Adobe's own documentation suggests a guardrail of roughly 75KB to 100KB per profile. In failing implementations, we often see profiles bloated to 500KB+ because the implementation team dumped raw data lakes into the Real-Time Customer Profile (RTCP) without an aggregation strategy. This doesn't just slow down the system; it creates a "consumption cliff" where license costs explode while performance degrades.
Key Diagnostic Metrics for AEP Health
- Time-to-First-Activation: Best-in-class projects activate a single, simple use case (e.g., churn suppression) within 90 days. If you are at month 6 without a live activation, you are in the "Red Zone."
- Schema Re-Use Rate: In healthy AEP instances, 60%+ of schemas are standard XDM (Experience Data Model) schemas. If 80% of your schemas are custom, you have built a walled garden that will be impossible to maintain or migrate.
- Ingestion Failure Rate: A healthy pipeline should have <1% record failure. High failure rates indicate upstream data hygiene issues that no amount of AEP configuration can fix.
Ignoring these metrics is a classic example of process documentation failure, where the focus on "go-live" obscures the reality of long-term operability.
The Cure: Selecting a Partner for Governance, Not Just Implementation
If your project is stalled, or if you are about to sign a Statement of Work (SOW), you must change your partner selection criteria. Most RFPs for AEP focus on "technical certification"—how many Adobe Certified Experts do you have? This is a vanity metric.
Instead, audit their process documentation. Demand to see their "Data Governance Runbook" from a redacted client. If they cannot produce a standardized playbook for XDM schema governance, identity namespace management, and segment taxonomy, they are not building a platform; they are building a prototype.
The 'Project Reset' Framework
If you are currently in a stalled implementation, do not throw more bodies at the problem. Pause the build and execute a 4-week governance audit. Map every data flow to a specific business outcome and purge any data ingestion that does not serve a prioritized use case (see our Project Reset Framework). Paradoxically, deleting data from AEP is often the fastest way to increase its value.
Successful AEP projects are 20% technology and 80% data governance. The partners who understand this will push back on your timeline to ensure the data foundation is solid. The ones who don't will promise you a 90-day go-live and hand you a broken machine in month 12.