
The practical answer
- Short answer
- Three out of four mid-market SaaS demos end in no-decision. The pattern behind it, and the three checks that separate a real $40k deal from a polite conversation.
- Best fit
- Industry: B2B SaaS. Function: Sales
- Operating path
- GTM Execution → Commercial Performance → Performance Improvement
- Key metric
- 44% Win rate for deals involving 3+ departments, compared to 28% for single-threaded deals.
The demo "went well." That's exactly the problem.
Picture a 35-minute demo to a 180-person logistics-software buyer. The account executive nailed it: walked the dashboard, the integrations tab, the reporting suite, the admin permissions, the mobile app, the API. The champion nodded the whole way and said "this is great, let me loop in a few people." Three weeks later, the thread is dead. No "no." Just silence.
That deal didn't die because the product was wrong. It died because the rep ran a training session for someone who hadn't bought anything yet. In mid-market B2B SaaS, only about one in four demos that reach a qualified opportunity actually closes—the other three end in closed-lost or, more often, no-decision. And the strongest signal that you're heading for no-decision is a demo where the prospect barely talks. Pull five recent recordings and clock it: if the buyer is speaking less than a third of the time, your rep is lecturing, and a lecture gives a committee nothing specific to fight for internally.
The fix is brutal subtraction. Discovery should have surfaced two or three pains that actually keep this buyer up at night—the warehouse can't reconcile inventory across regions, finance can't close the month without manual exports, whatever it is. Show only the path through the product that resolves those, and stop. Optifai's benchmark data puts interactive, narrative-led demos at roughly 38% conversion versus about 22% for the standard screen-share tour. The gap isn't charisma. It's that a narrow, problem-anchored demo hands the champion a story they can repeat in a meeting you're not in—and that meeting is where mid-market deals are actually won or lost. If your team is camped at the 25% line, treat it as a fixable process and run a structured 60-day win rate turnaround aimed at narrative discipline, not feature coverage.
If your rep can't name the person who signs the contract by the third meeting, you don't have a deal—you have a conversation that happens to involve a calendar invite.
One champion is not a deal. It's a single point of failure.
Here's the uncomfortable arithmetic of the mid-market: the buying group has grown to roughly six to ten people, but most reps are still selling to one of them and hoping that person does the rest of the selling for free, inside an org you can't see, against priorities you don't know about. When the champion gets reorged, pulled onto a fire drill, or simply loses interest, the deal doesn't slow down—it vanishes. That's the silence in the example above.
Outreach and Gong's data on cross-department engagement is stark: deals where the seller is active across three or more functions—say IT, Finance, and Operations—win around 44% of the time, against roughly 28% for single-department deals. For a logistics-software buyer, that means the demo champion in Ops is not enough. IT has to believe the integration won't break their SSO setup. Finance has to see the line item survive a budget conversation. The user lead in the warehouse has to want it badly enough to defend it. Each of those is a separate thread with a separate reason to care—and you build them by name, not by adding people to a cc field. This is the single-threaded trap that quietly empties a quarter-end forecast.
Run a simple test after every demo: can the rep name the person who will physically sign the contract, and the person who will object to the price, and the person who will fight to get it deployed? If any of those three is a blank, that's the next call to book—not the pricing email. A blank on the signer, specifically, means you don't yet have a deal. You have a relationship with someone who likes your product.
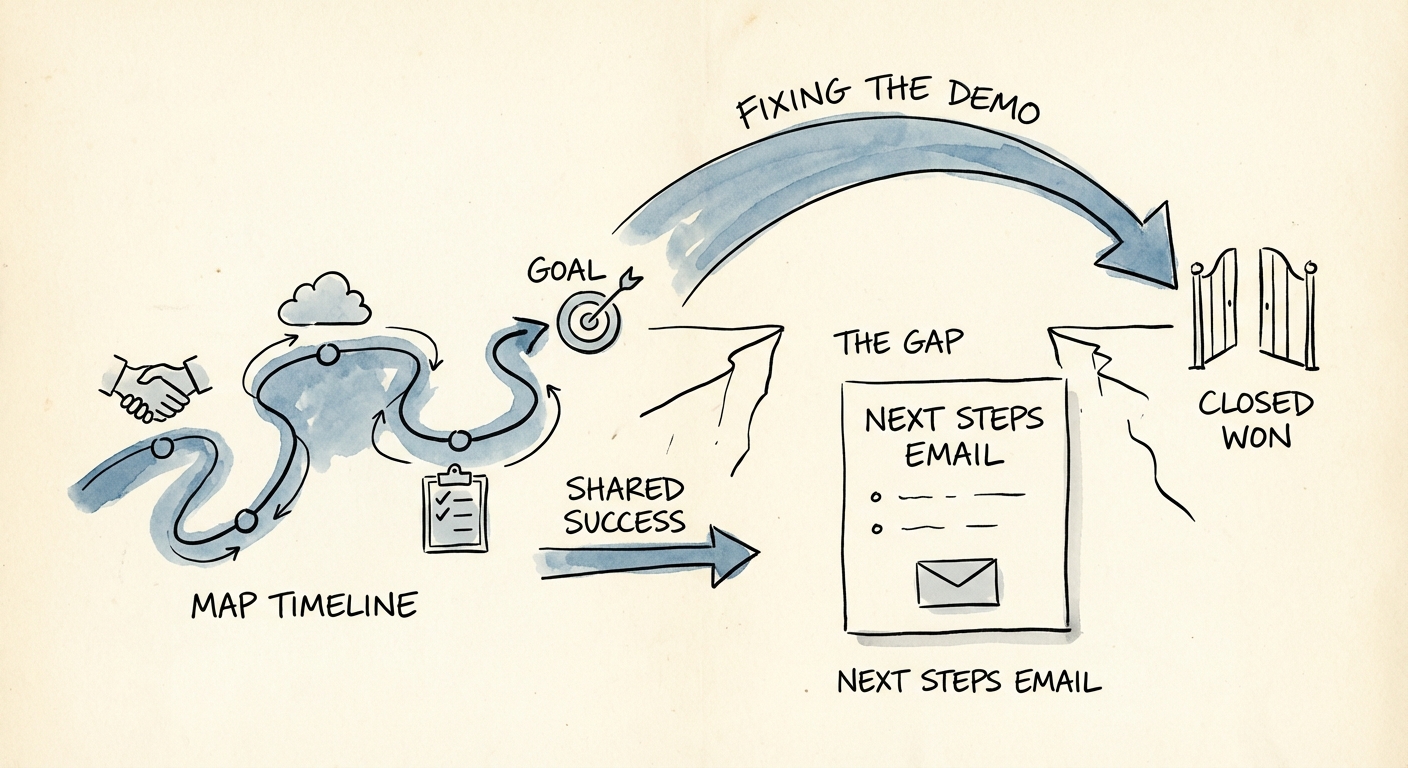
"I'll send pricing" is where deals go to die quietly
The third failure is the one reps inflict on themselves. The demo ends, everyone's happy, and the rep closes with "I'll send over pricing" or "let us know what you think." Both are surrenders dressed up as next steps. They hand control of the timeline to a committee that has eleven other priorities and no deadline attached to yours.
The counter-move is a Mutual Action Plan—a shared, dated path from "interested" to "live." You start from a realistic go-live date and work backward through the milestones a mid-market buyer actually has to clear: security review, an integration test against their existing stack, legal redlines, procurement signoff. The MAP does two jobs at once. It turns a vendor-driven push into a project both sides own, and it surfaces risk early—if the buyer can't name who runs security review, you've found the landmine before it detonates in week ten. Salesforce's guidance on mutual action plans frames it well: a buyer who won't co-author a plan is telling you something true about whether this is real.
That matters most in the exact deal we've been describing. For ACVs in the $20k–$60k range, sales cycles run around 115 days—nearly four months in which a single-threaded, plan-less deal has every opportunity to drift into next year's pipeline. So make Monday concrete: pull your last five demos, count buyer talk-time, list every named stakeholder by role, and for any deal in commit or best-case, send a draft MAP with a proposed go-live date this week. The ones that come back edited are real. The ones that go quiet were always going to.